While we have the configuration to disable distinct (mentioned in a deleted response), that configuration is highly experimental (not apart of our documented public interface for aml) and after internal testing we find it not really usable since it mess with other other functionality that required distinct values (for example filter suggestion).
In your case, our advice is to change the Custom Chart to require a dimension and a measure instead:
a dimension to define the data grain
a measure to define the metric that you want to create the histogram on.
This set-up will work for your case while be more reusable. For example, if in your case you want the Histogram of Total amount for each swap then you would drag in the swap_id dimension and the Sum of amount_usd. Since this is more reusable, you can even change the dimension to user_id to get the Histogram of Total amount for each user
Is there any hidden limit in the holistics executed query? (I have a total of more than 3M records)
After I do as you told me, the query automatically applies order by DESC into the query. Then now, the small volumes are not shown in the dashboard anymore.
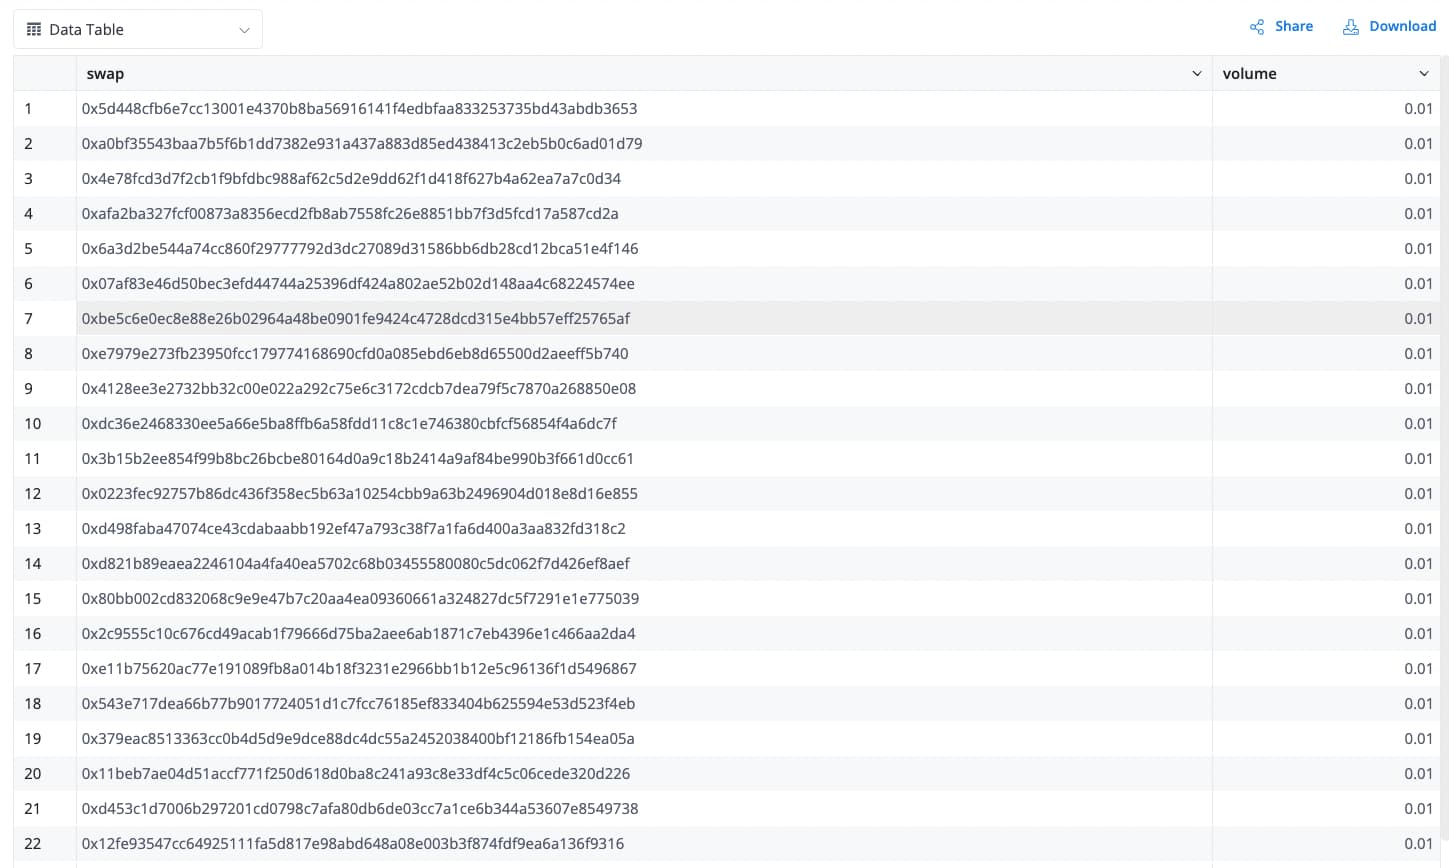
When I use the SQL editor to check, there are still lots of records that have volumes lower than 1: