I’m working on a column chart and am trying to shrink the gaps between the bars. I can see that Holistics is spacing out the bars based on the calendar date of the bar, but I would prefer to have them placed side-by-side, ordered by the calendar date but not spaced-out by the calendar date.
As an example:
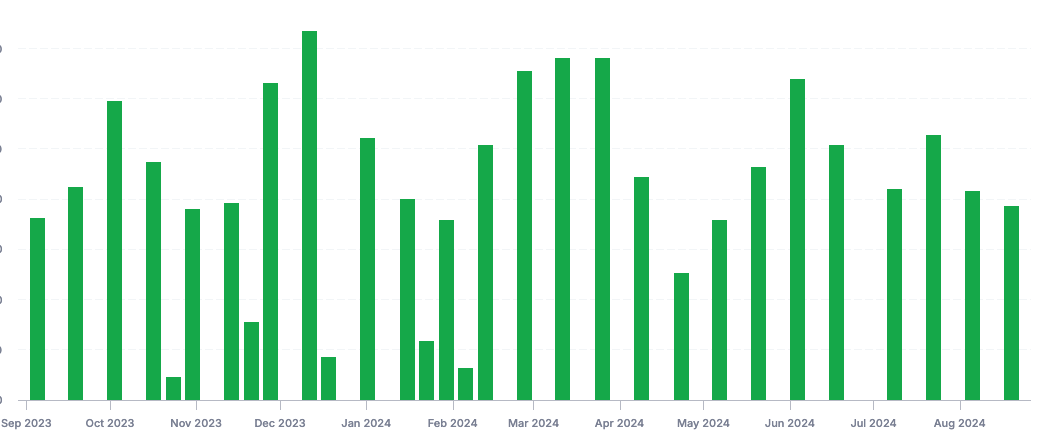
x-axis Date
y-axis Kilometers Hiked
The bars are spaced out unevenly because the dates are not at regular intervals. This uneven spacing leads to the bars being quite narrow (controlled by the two most closely spaced bars). Is there a way to use the date to ORDER the bars, but then to simply place the bars one after another? The look I am going for is achieved in your example where each bar is a separate country and the order is alphabetical: https://cdn.holistics.io/docs/readme/3c97c47-too_many_columns.png
It will be easier to see trends if there are not such large gaps between bars.
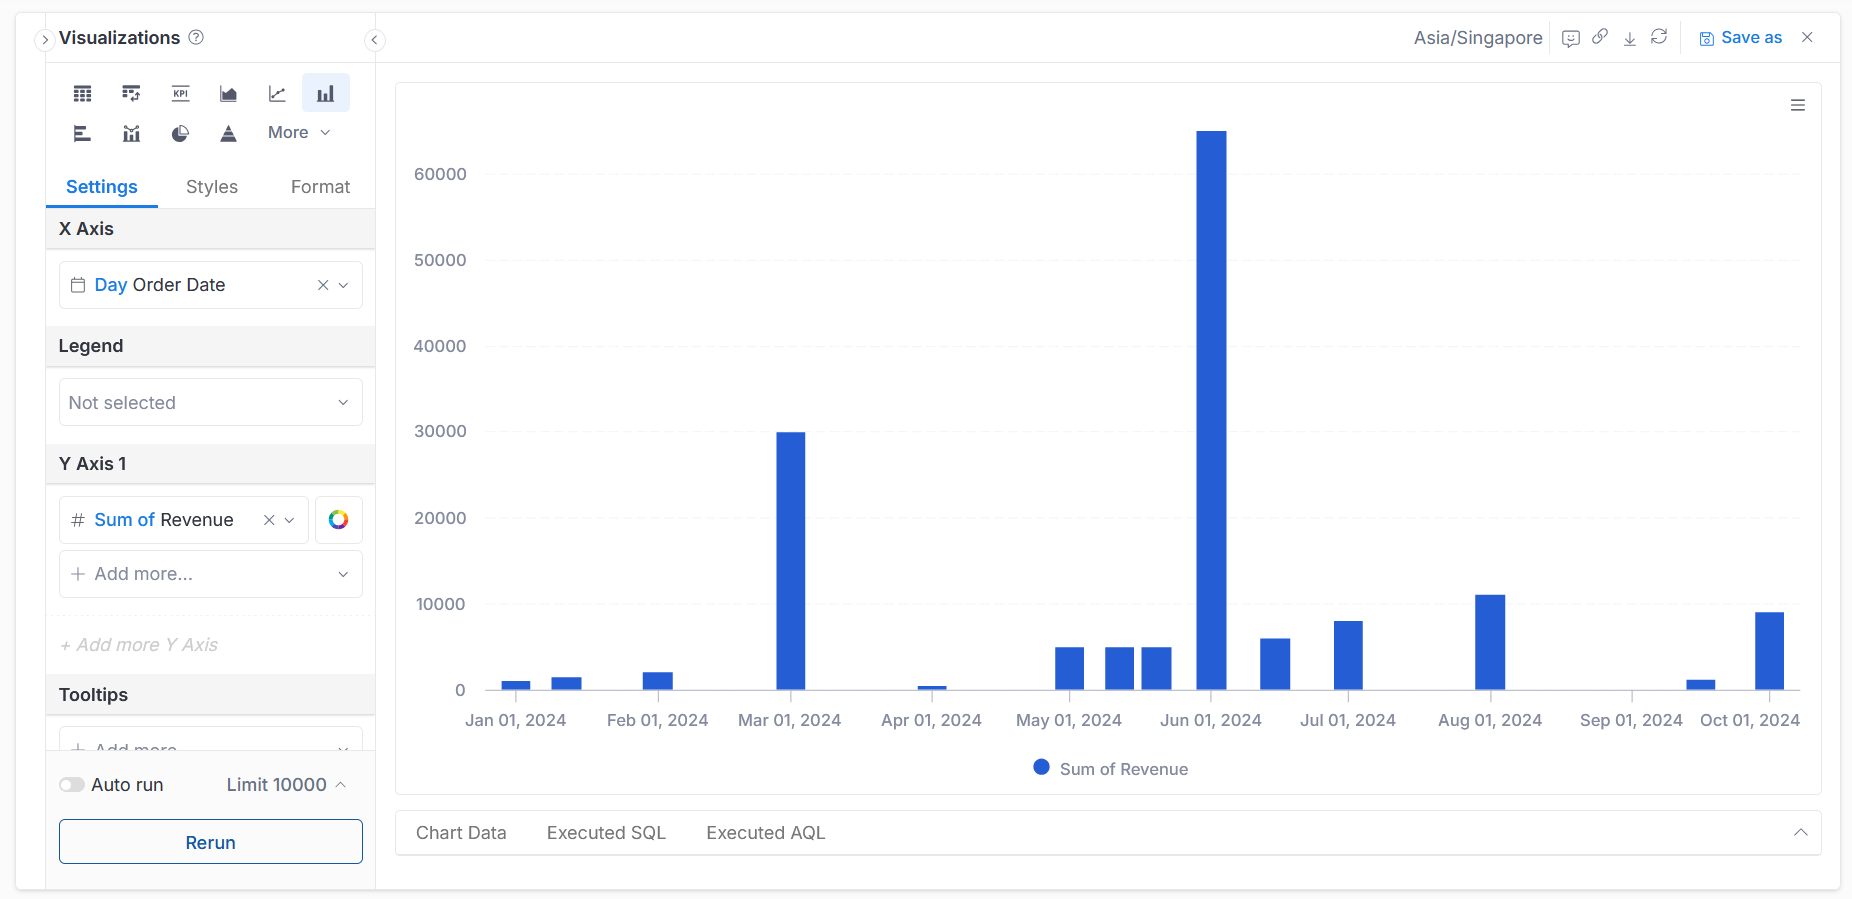
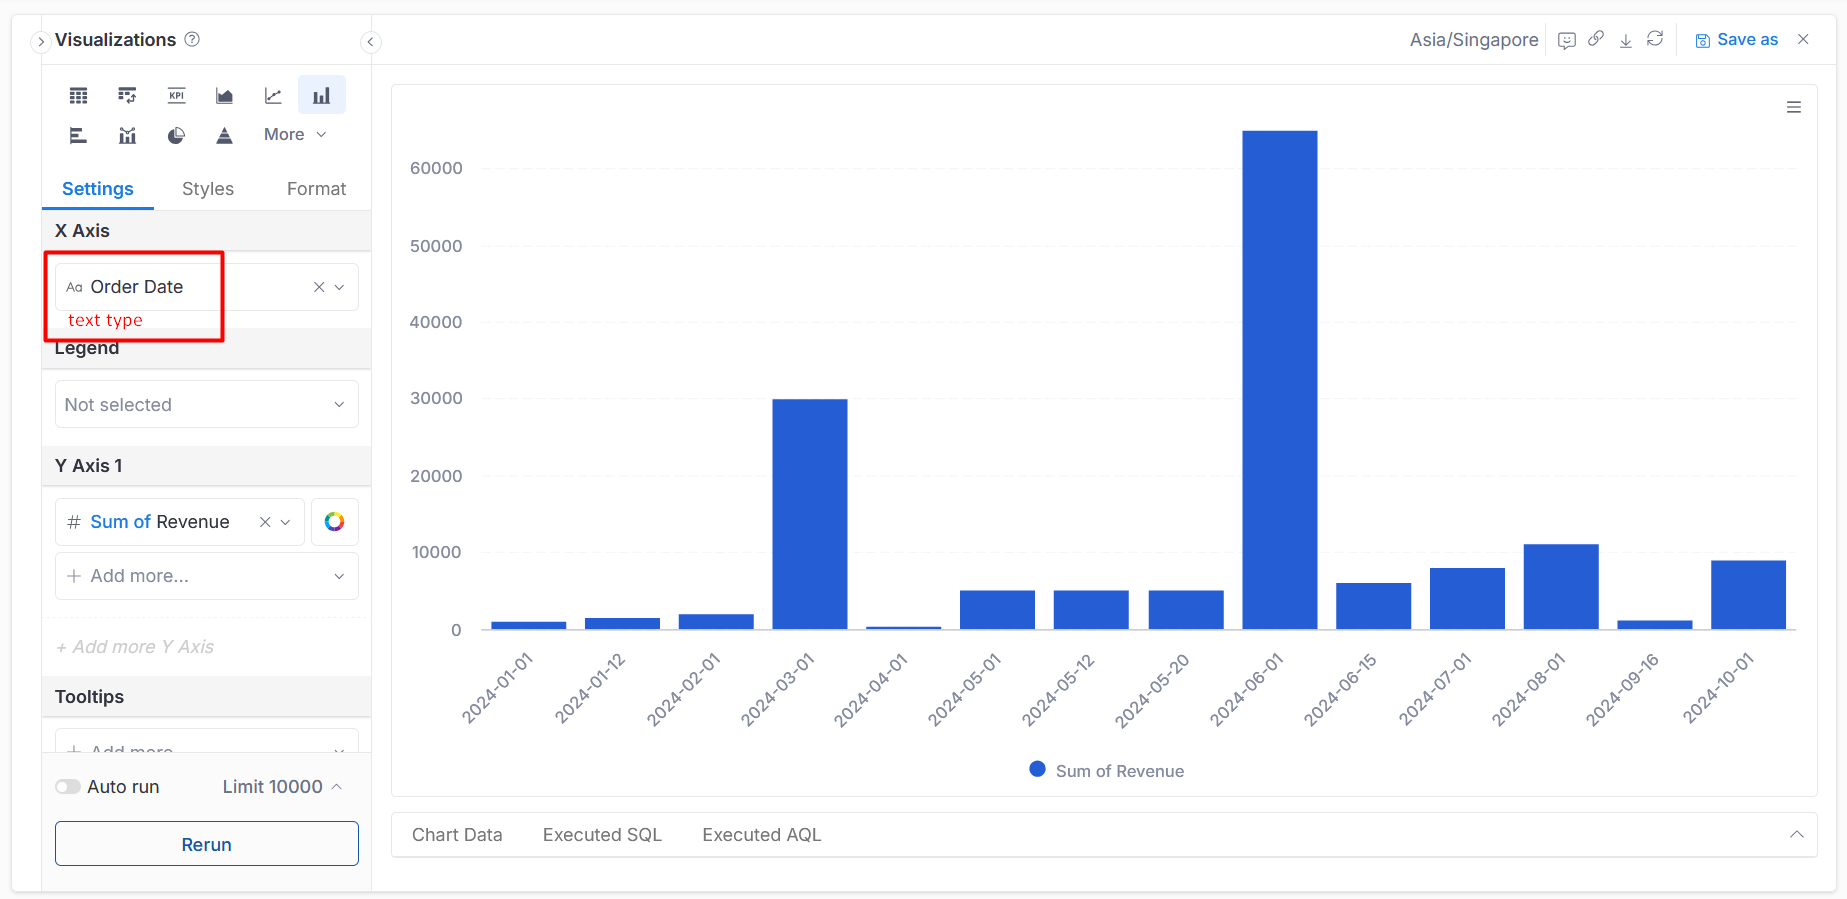
When using dates on the X-Axis, if the dates are not at regular intervals, the spacing between the bars cannot be displayed evenly.
Unfortunately, there is no workaround for this due to the date field being a Continuous Dimension. Unlike Discrete Dimensions like Category Name, Continuous Dimensions behave differently when plotted on a Bar chart.
If you want to view the data trend, I recommend using our trendline feature, or you can consider using our Line Chart instead if Bar Chart in this case.
If the trendline does not meet your expectations, could you please share more details about what you are looking for by seeing the trend? This will help us better understand your needs and offer more tailored support
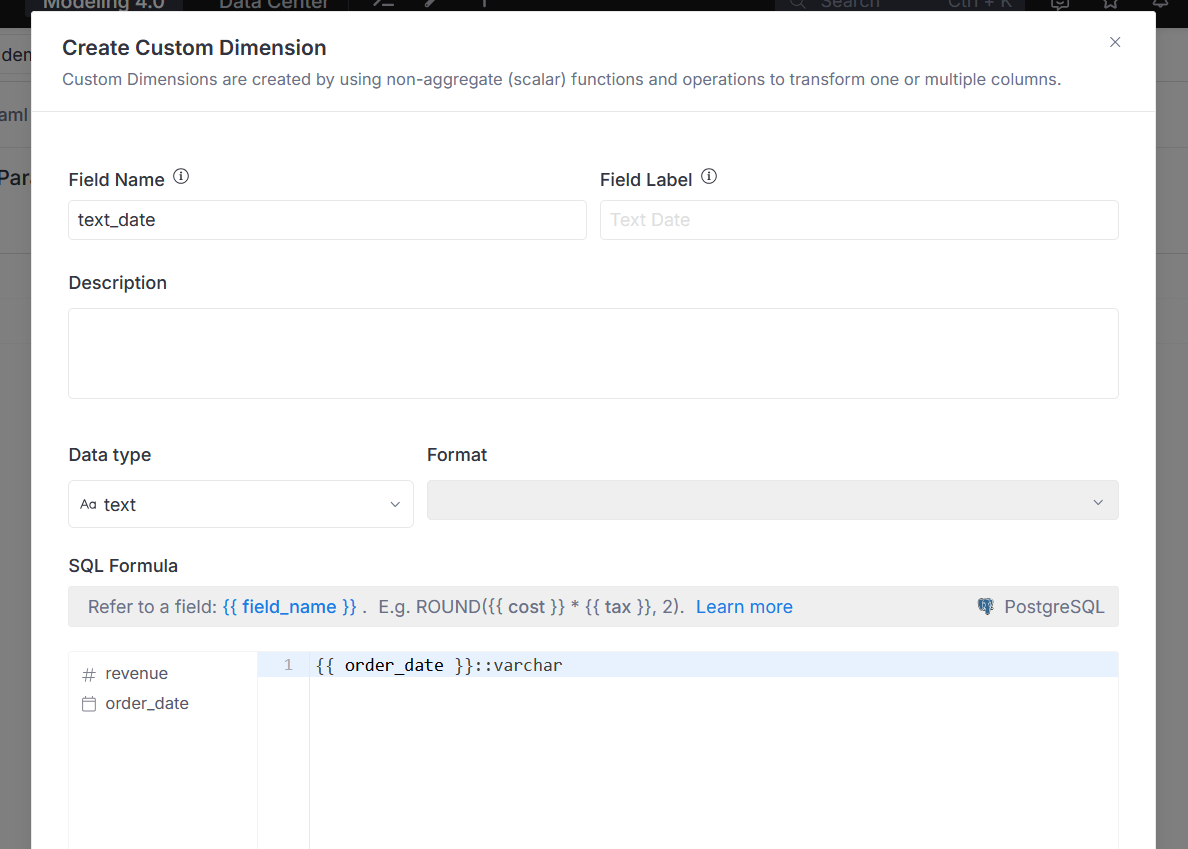
I guess I can come up with a new dimension that creates an index for each of these bars, then use that as the x-axis? They would just be labeled 1, 2, 3, 4 then instead of with the meaningful date. I might give it a try to see if our customers would prefer that.
We’ve historically used different varieties of bar charts where one bar represents one sales cycle. Our customers want to see how they did in all of their sales cycles but do not want to be bothered with different lengths of time between sales cycles. I agree that another type of graph could work, but at this point we’re not ready to switch up our external facing reporting assets.