Howdy everyone! ![]()
Use Case
Suppose you have a chart that shows monthly signups. You want to see a reference line that represents the average monthly signups of all time. When changing dashboard filters, you don’t want this reference line to be affected, so that you can always compare data against a global average number.
How might we solve this?
 Approach 1: Reference Line. Currently this can’t be achieved using just the Reference Line feature. We’ll overcome this limitation soon so that you can achieve this use case easily.
 Approach 2: AQL metric using the
 of_allfunction: In the mean time, you can write an AQL metric that’s not affected by dashboard filters, and turn it into a line.
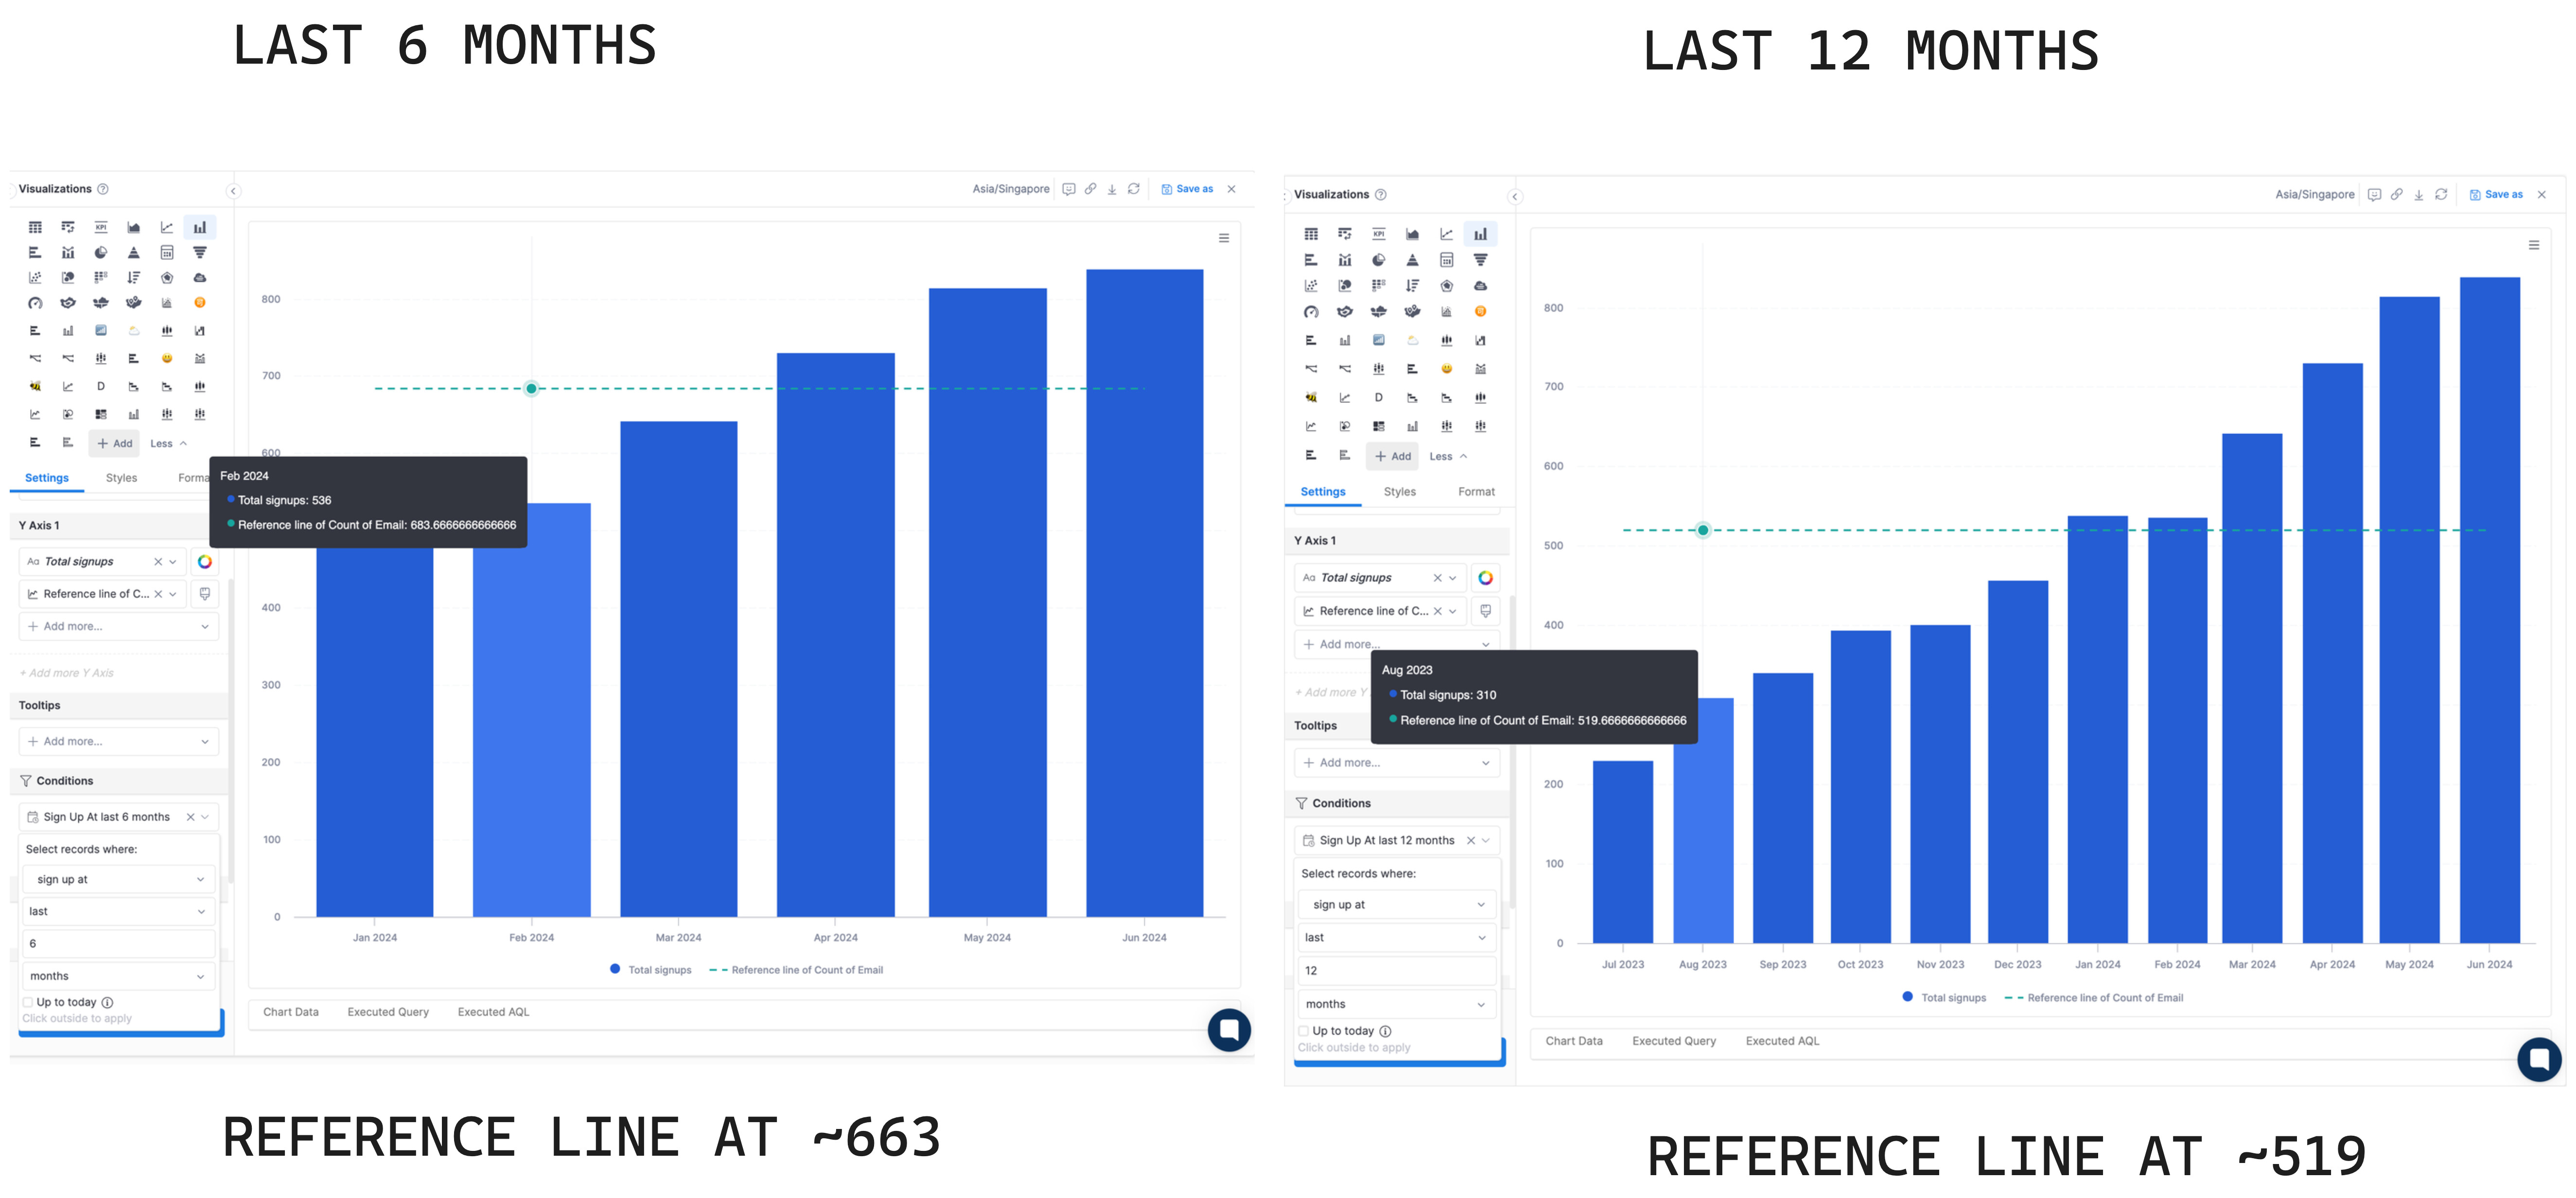
Approach 1: Reference Line (will be affected by filters)
When you create a viz with a reference line using the Reference Line feature, and change the timeframe from “6 month” to “12 month”, the reference line is affected by that filter, and also any dashboard filter that links to this chart.
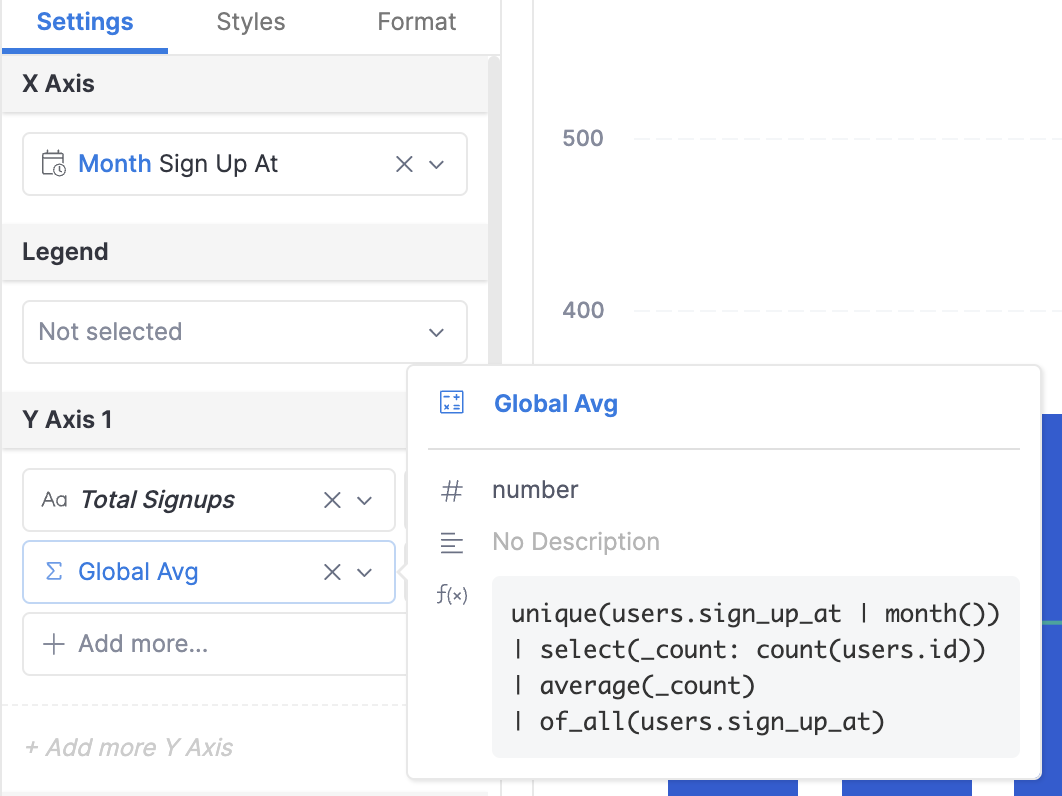
Approach 2: AQL metric using the of_all function (unaffected by filters)
The trick is to use a Combination Chart, then define the average total signups using AQL like this:
The result will look like this: the reference line isn’t affected by filters.
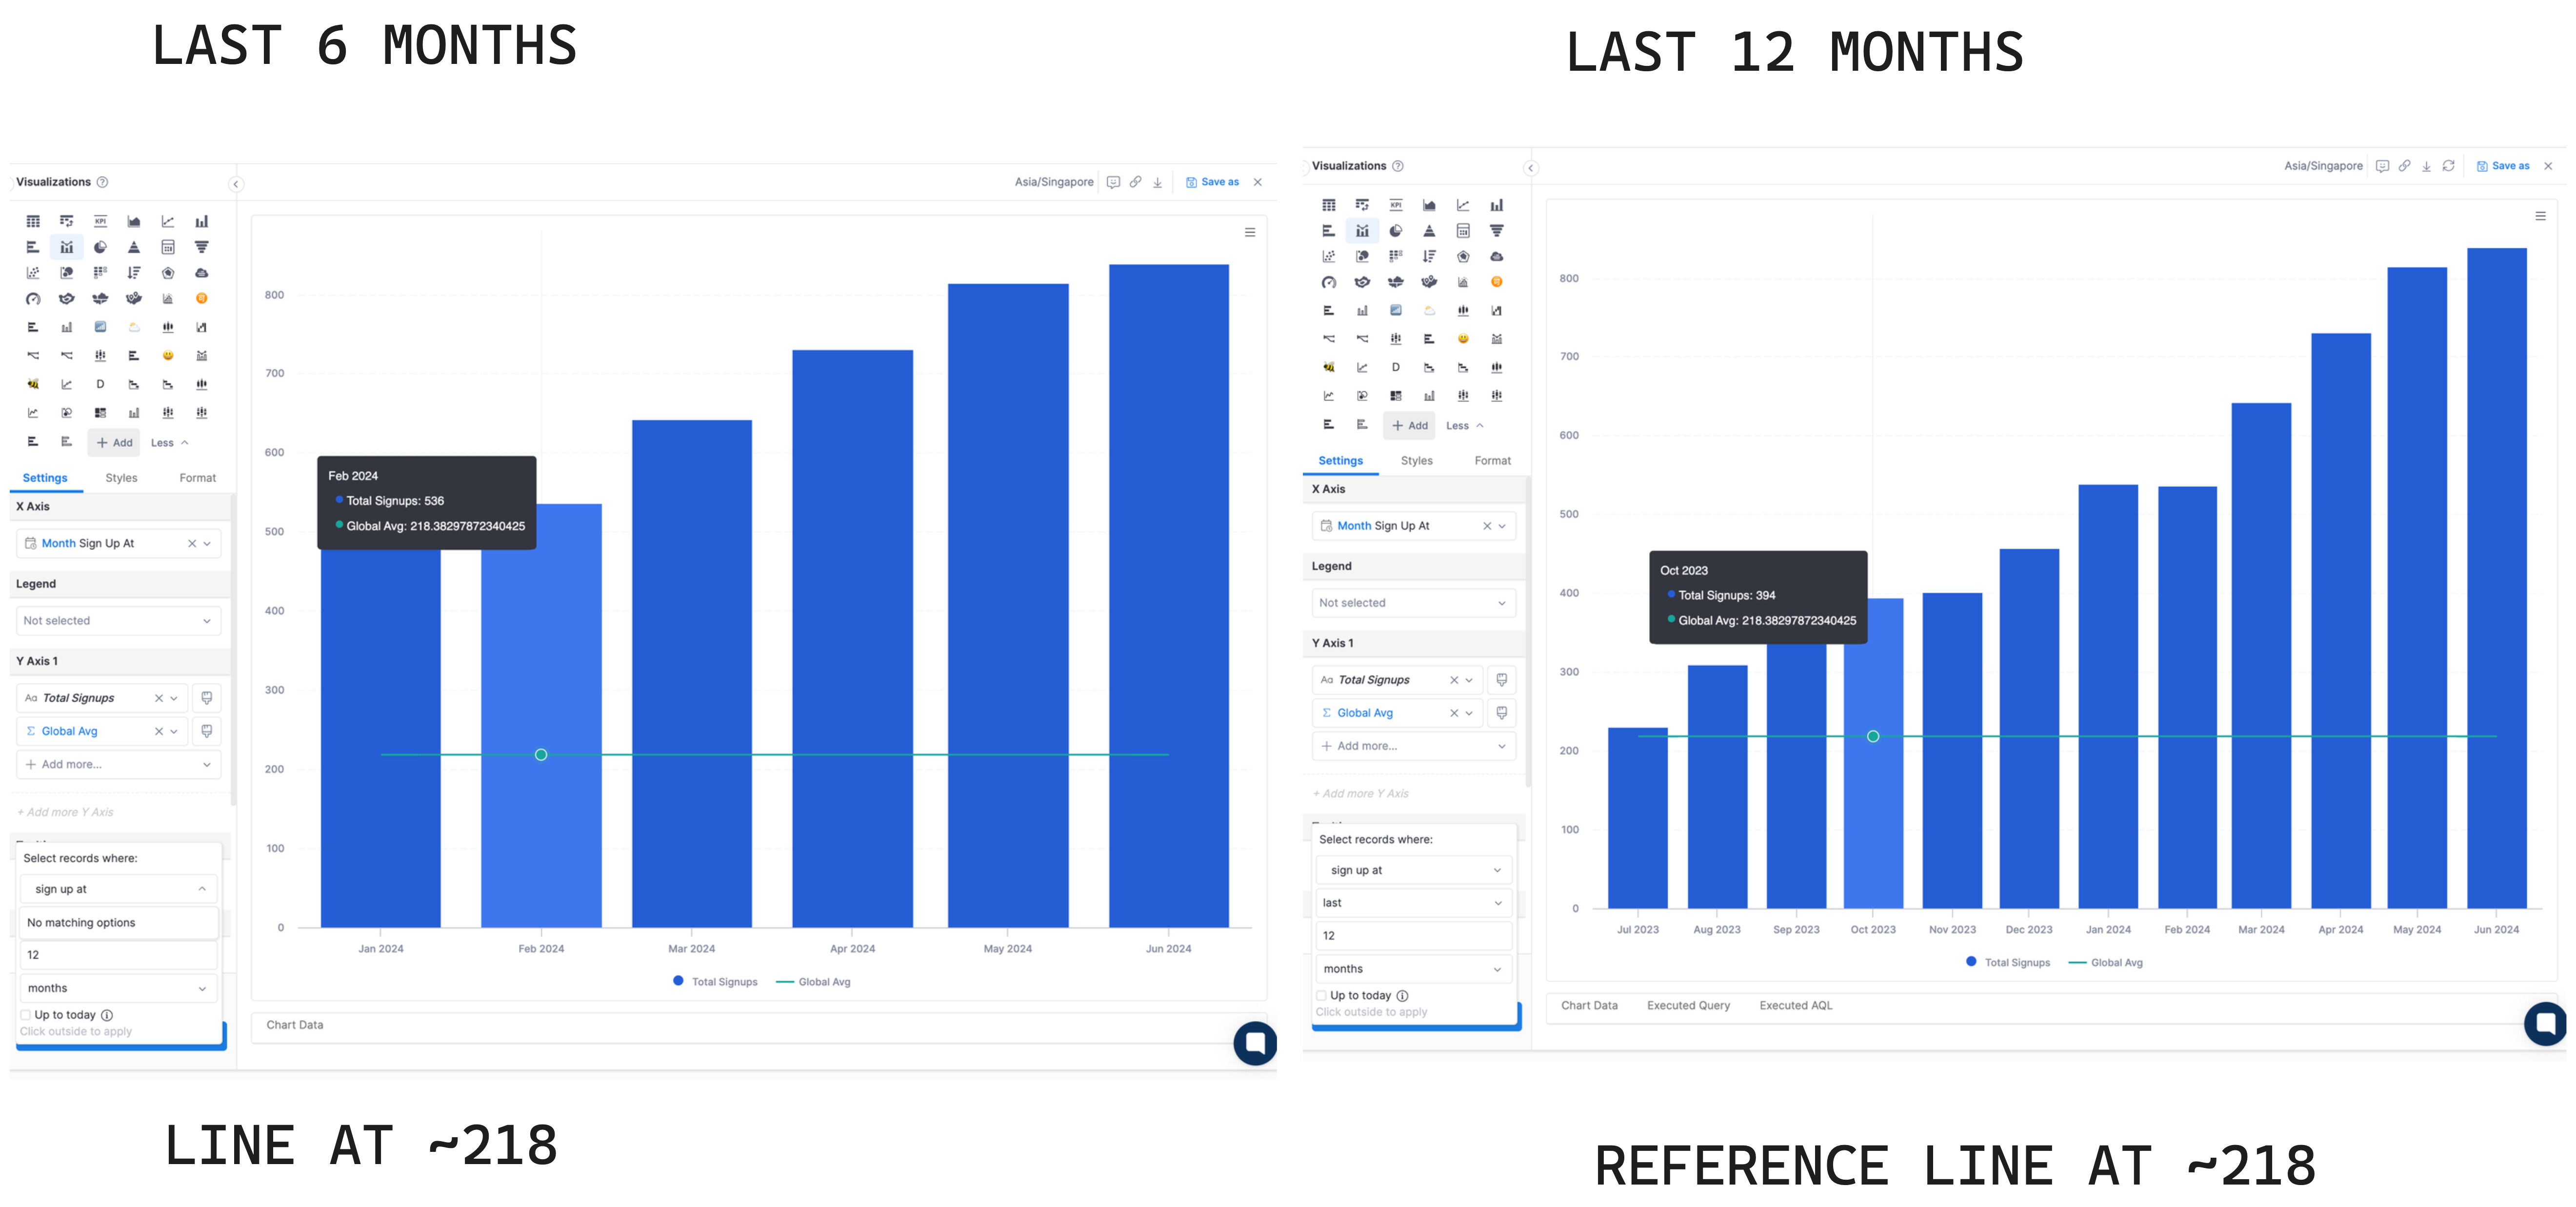
Why it works?
of_all function is used to specify the grain at which you want to calculate the metric. This will make the metric calculation independent from dashboard filters.
Prefer a more interactive explanation?
I’ve recorded a short video explaining this approach here: