Tired of copy-pasting metric definitions every time they change? With our string interpolation feature, your dashboard’s metric catalog stays in sync automatically. One source of truth—no more manual edits!
How to use it
Let’s say you have a list of metrics with their description like below
Dataset ecommnerce {
  label: 'Ecommerce'
  description: 'Dataset about ecommnerce'

  metric gmv {
    label: "GMV - Gross Merchandise Value"
    description: "Total value of all orders before discount."
  }

  metric total_discount {
    label: "Total Discount"
    description: "Total Discount: Total discount value of all orders."
  }

  metric nmv {
    label: "NMV - Net Merchandise Value (Post-Discount & Fulfillment)"
    description: "* Fulfilled order value after discount. Excludes cancelled/refunded orders. <br>* Represents the total paid value of fulfilled orders, excluding cancelled and refunded orders, and adjusted for any discounts applied. <br>* This reflects what customers actually paid for successfully completed transactions, and serves as the revenue base before applying commission."
  }

  metric revenue {
    label: "Total Revenue (Platform)"
    description: "Represents the total revenue earned by the platform based on fulfilled order value (NMV), multiplied by a commission rate. <br> As of May 2025, this demo assumes a 50% commission margin. Formula: `revenue = NMV × revenue_commission`"
  }

}
And then in the dashboard, you can create a new textblock with this definition
Dashboard ecommerce_performance {

   block metric_catalog: TextBlock {
       content: @md
   | Metric          | Name                                                   | Description                                                     |
   |-----------------|--------------------------------------------------------|-----------------------------------------------------------------|
   | GMV             | ${ecommnerce.metric.gmv.__meta__.name}            | ${ecommnerce.metric.gmv.description}              |
   | Total Discount  | ${ecommnerce.metric.total_discount.__meta__.name} | ${ecommnerce.metric.total_discount.description}   |
   | NMV             | ${ecommnerce.metric.nmv.__meta__.name}            | ${ecommnerce.metric.nmv.description}              |
   | Revenue         | ${ecommnerce.metric.revenue.__meta__.name}        | ${ecommnerce.metric.revenue.description}          |
   ;;
  }

}
And this is the outcome you will get in the dashboard
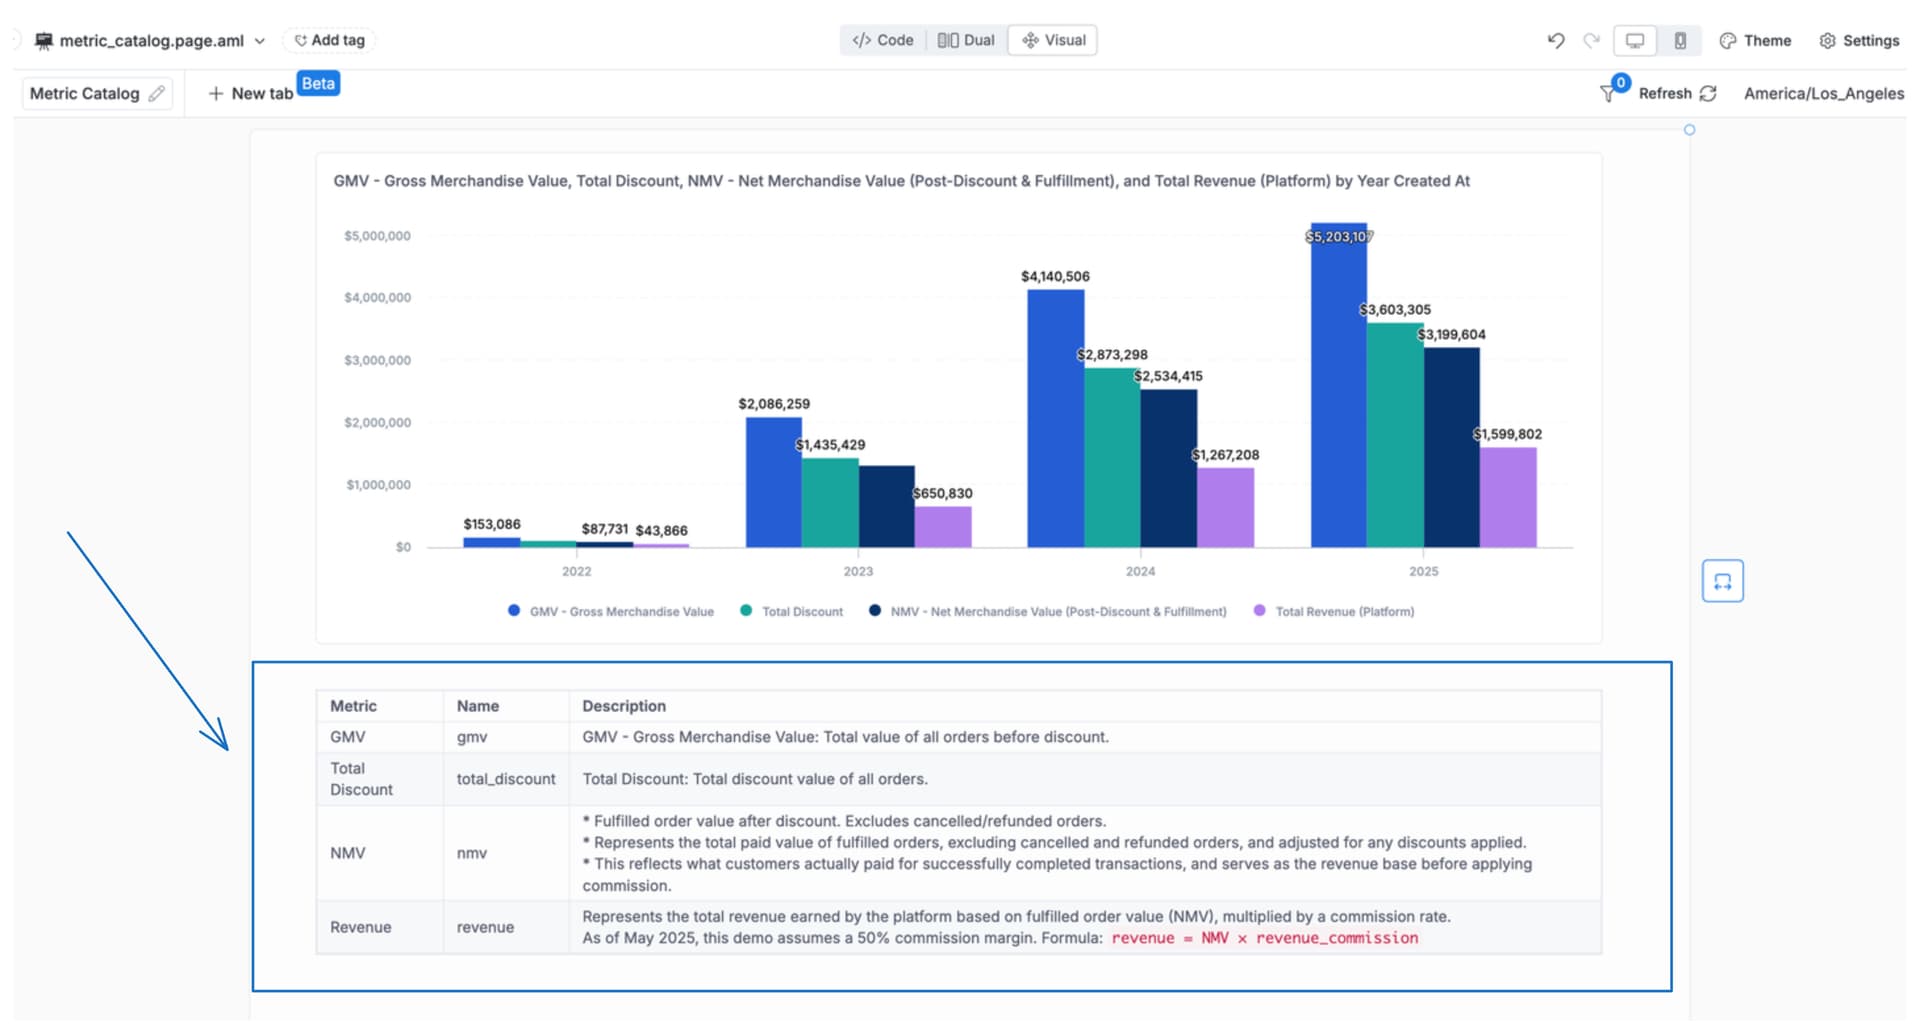
Now, if you ever change the metric’s label or description in your model or dataset, your dashboard’s metric catalog updates automatically.
You can do the same for models, datasets, and dimensions—showcasing any information you want, always in sync!
Limitation
This can only be done in the Code view of the Dashboard.
If you use Visual mode to edit the Textblock, it will automatically convert interpolations into inline strings in the markdown.
This is the known limitation and we will improve this in the future.