I would be interested in being a beta customer for this feature!
1 Like
Hi!
I would like to be able to see dashboards that don’t have any viewers as well. Right now I only seem to see dashboards with viewers.
I would also be great to filter on a specific dashboard and see which users have viewed it.
1 Like
Hi @andrea,
(1) About seeing the dashboards with zero views (or viewers): Totally got your point here ![]()
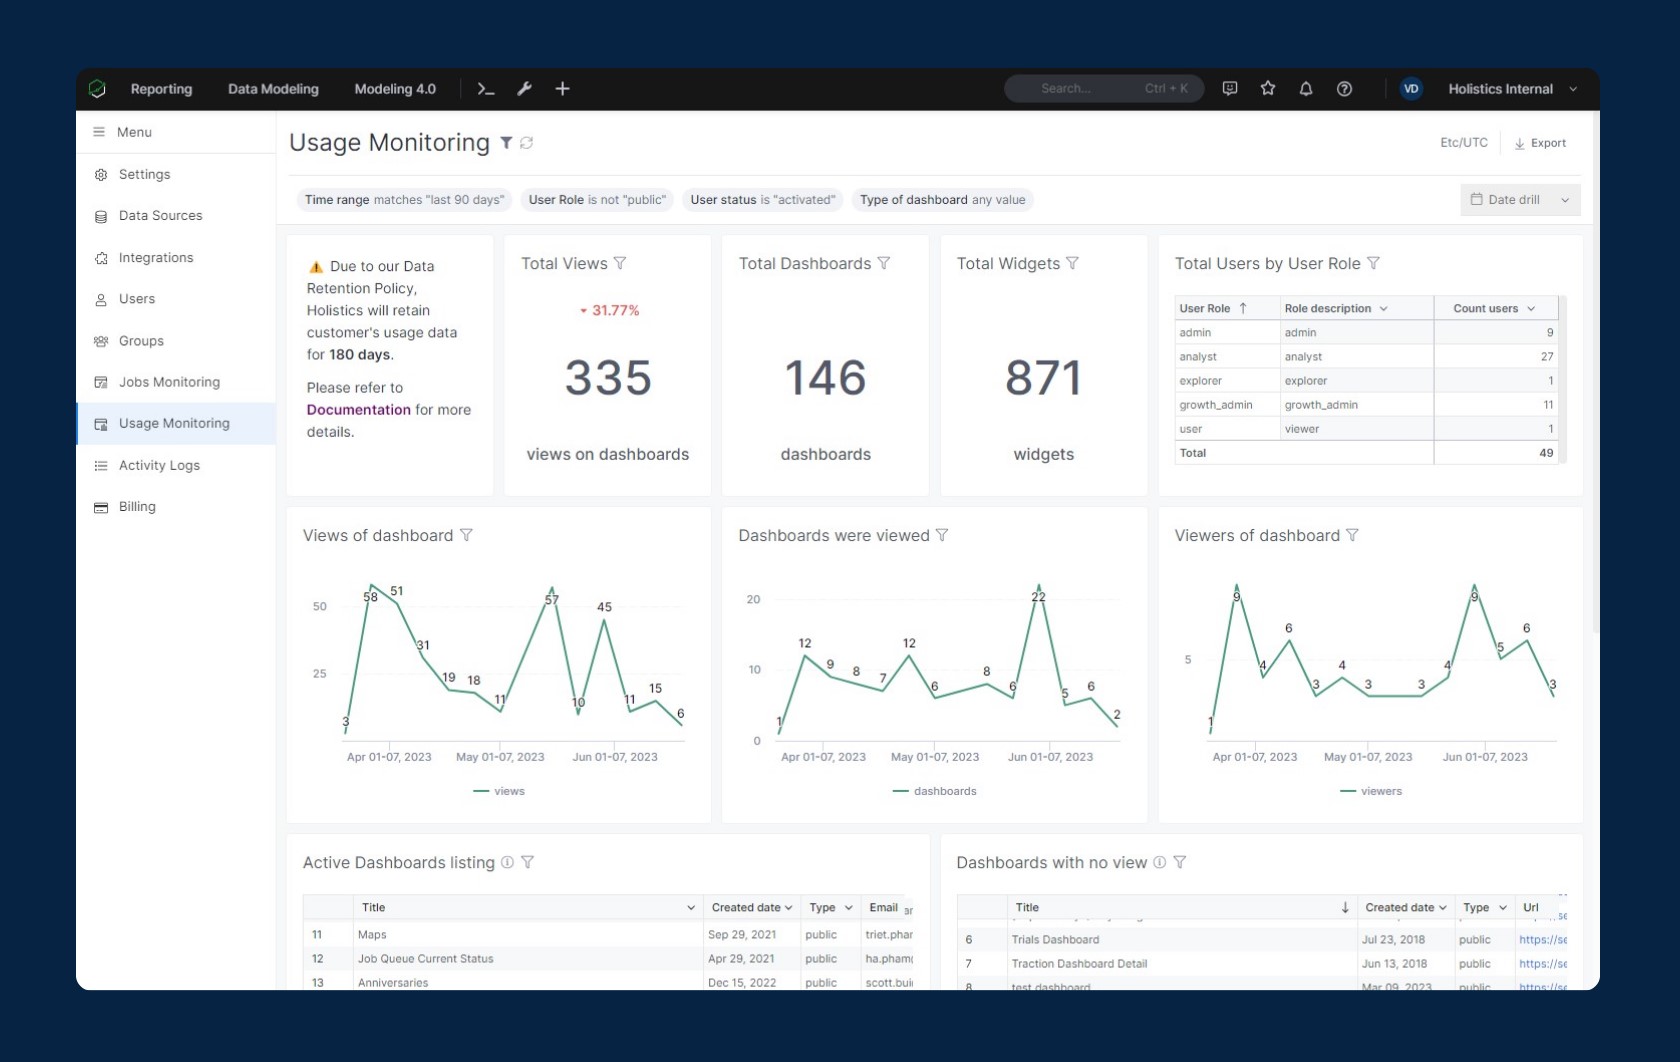
The good news is: we’re actually planning to release a new version of Usage Monitoring this month, with a widget that lists all dashboards with no view, alongside other new upgrades.
Gotta cc @DataGeekDude on this as well, since you’ve had a similar request earlier ![]()
(2) About being able to filter on a specific dashboard
Absolutely! You can actually utilize Cross-filtering for this specific goal.
Just click on a dashboard from the Active Dashboards listing widget, and the other widgets (User listings, Total Views, etc.) will be filtered accordingly.
Cheers! ![]()
My apologies for missing the announcements here, @Guido_Stark and @DataGeekDude! ![]()
For tracking usage metrics of deleted users: Our team has released both a dashboard filter for User status and a column of “User status” in the current version. Hope it comes in handy!
Regarding your suggestion to change nulls to zeros: This is a really good point for an improvement! Thanks, guys for raising this ![]()
We actually had a discussion about this internally, but then had to put a pin in it since this might cost slightly more in terms of performance. That said, it’s a worthwhile improvement to get back to later.
Cheers!
I just tried this out and the bottom left widget Users with no dashboard view activity still contains users that are deleted. My filter was set as the following:

So I would not expect deleted users, which have been deleted for more than 6 months, to appear in the list of users with no activity. It seems as though that filter isn’t working on the widget (I haven’t checked any other widgets)
1 Like
Hi Craig,
Thank you for reporting the bug in our usage monitoring dashboard.
We have fixed the issue, and the dashboard is now working as expected. We apologize for any inconvenience caused by this unexpected bug. If you have any further questions or encounter any other issues, please let us know. Your feedback is highly appreciated.
3 Likes
Hi everyone ![]() ,
,
As the Beta program has come to a successful close, we are pleased to announce the Official release of the Usage Monitoring feature!
During the Beta phase, we introduced numerous upgrades to the Usage Monitoring dashboard, including:
-
 Additional widgets: A list of Dashboards with no views & a list of Users with no viewing activities
 -
Additional tracking: Usage of private dashboards, in addition to public workspace dashboards
-
Dashboard performance improvements
- and many more!
We extend a huge thanks to our beta users, for your interest and great support throughout the process!
For additional information, please refer to our public document: Usage Monitoring | Holistics Docs.
Cheers! ![]()
Further notes:
- The Usage Monitoring dashboard will be released to all Holistics customers.
- However, certain extra features in Usage Monitoring will only be available in Standard plan and above, following the latest Pricing version (learn more).
- These features include:
- Export of Widget data (Excel, CSV)
- Date-drill
- For beta testers who are in the Entry plan, we’d love to offer you a 3-month trial to continue using these extra features. Please let us know if you are interested in further trial.
- These features include:
For further enquiries, please let us know via this form: Holistics’ New Features - Enquiry Form.
3 Likes
Extra metrics related to:
- Widget query execution time
- Widget query render time
Would be a fantastic addition
1 Like
Hi @raulcruzv!
Thank you for sharing this suggestion. Definitely agreed that widget load time info is very essential.
Since Usage Monitoring focuses on how your users are utilizing the dashboards/reports, we made a decision to exclude performance metrics (such as load time) from this feature.
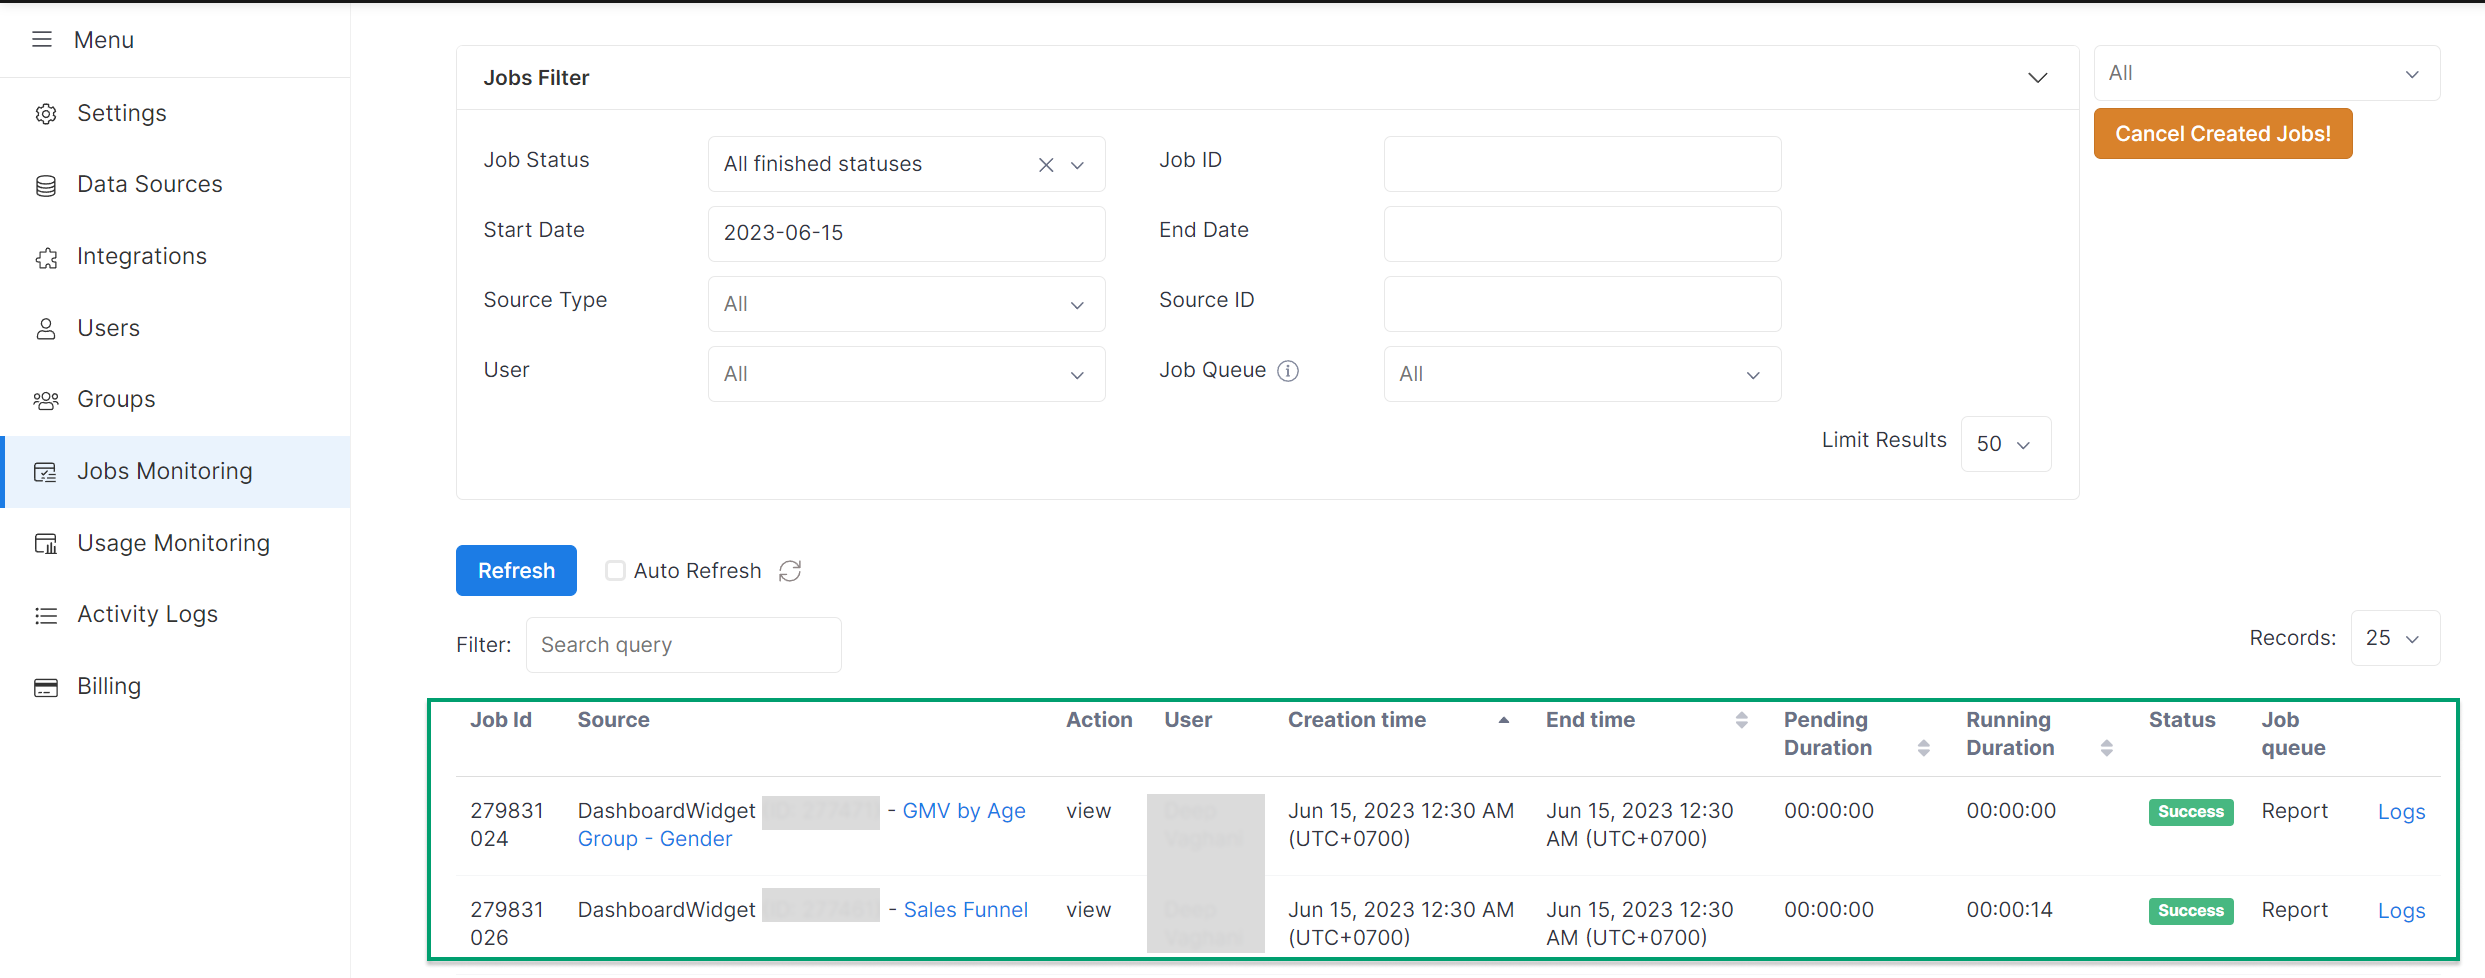
Instead, we support it in another feature called Job Monitoring (Job Monitoring | Holistics Docs). With this, you can see information like widget’s query load time, queue time, the action that generated this job, etc.
I hope my reply is helpful. Do let me know if this is ideal for you, or if you’ve got further questions, Raul.
Cheers! ![]()
1 Like