I would like to be able to manually change the size of the bar charts so that I can control how many options are visible at a time on the chart. Then be able to scroll to see the rest of the list when needed.
Hi Joe, This is indeed a very useful suggestion. I think that will make the bar chart more visually comprehensive.
I will add this request to our backlog for our future chart improvement.
1 Like
- and allow a limit on the resulting visualzation, like “top 10 x”.
- and alow the option to "Group small values into “Other” to consider the total when there is a stacked bar.
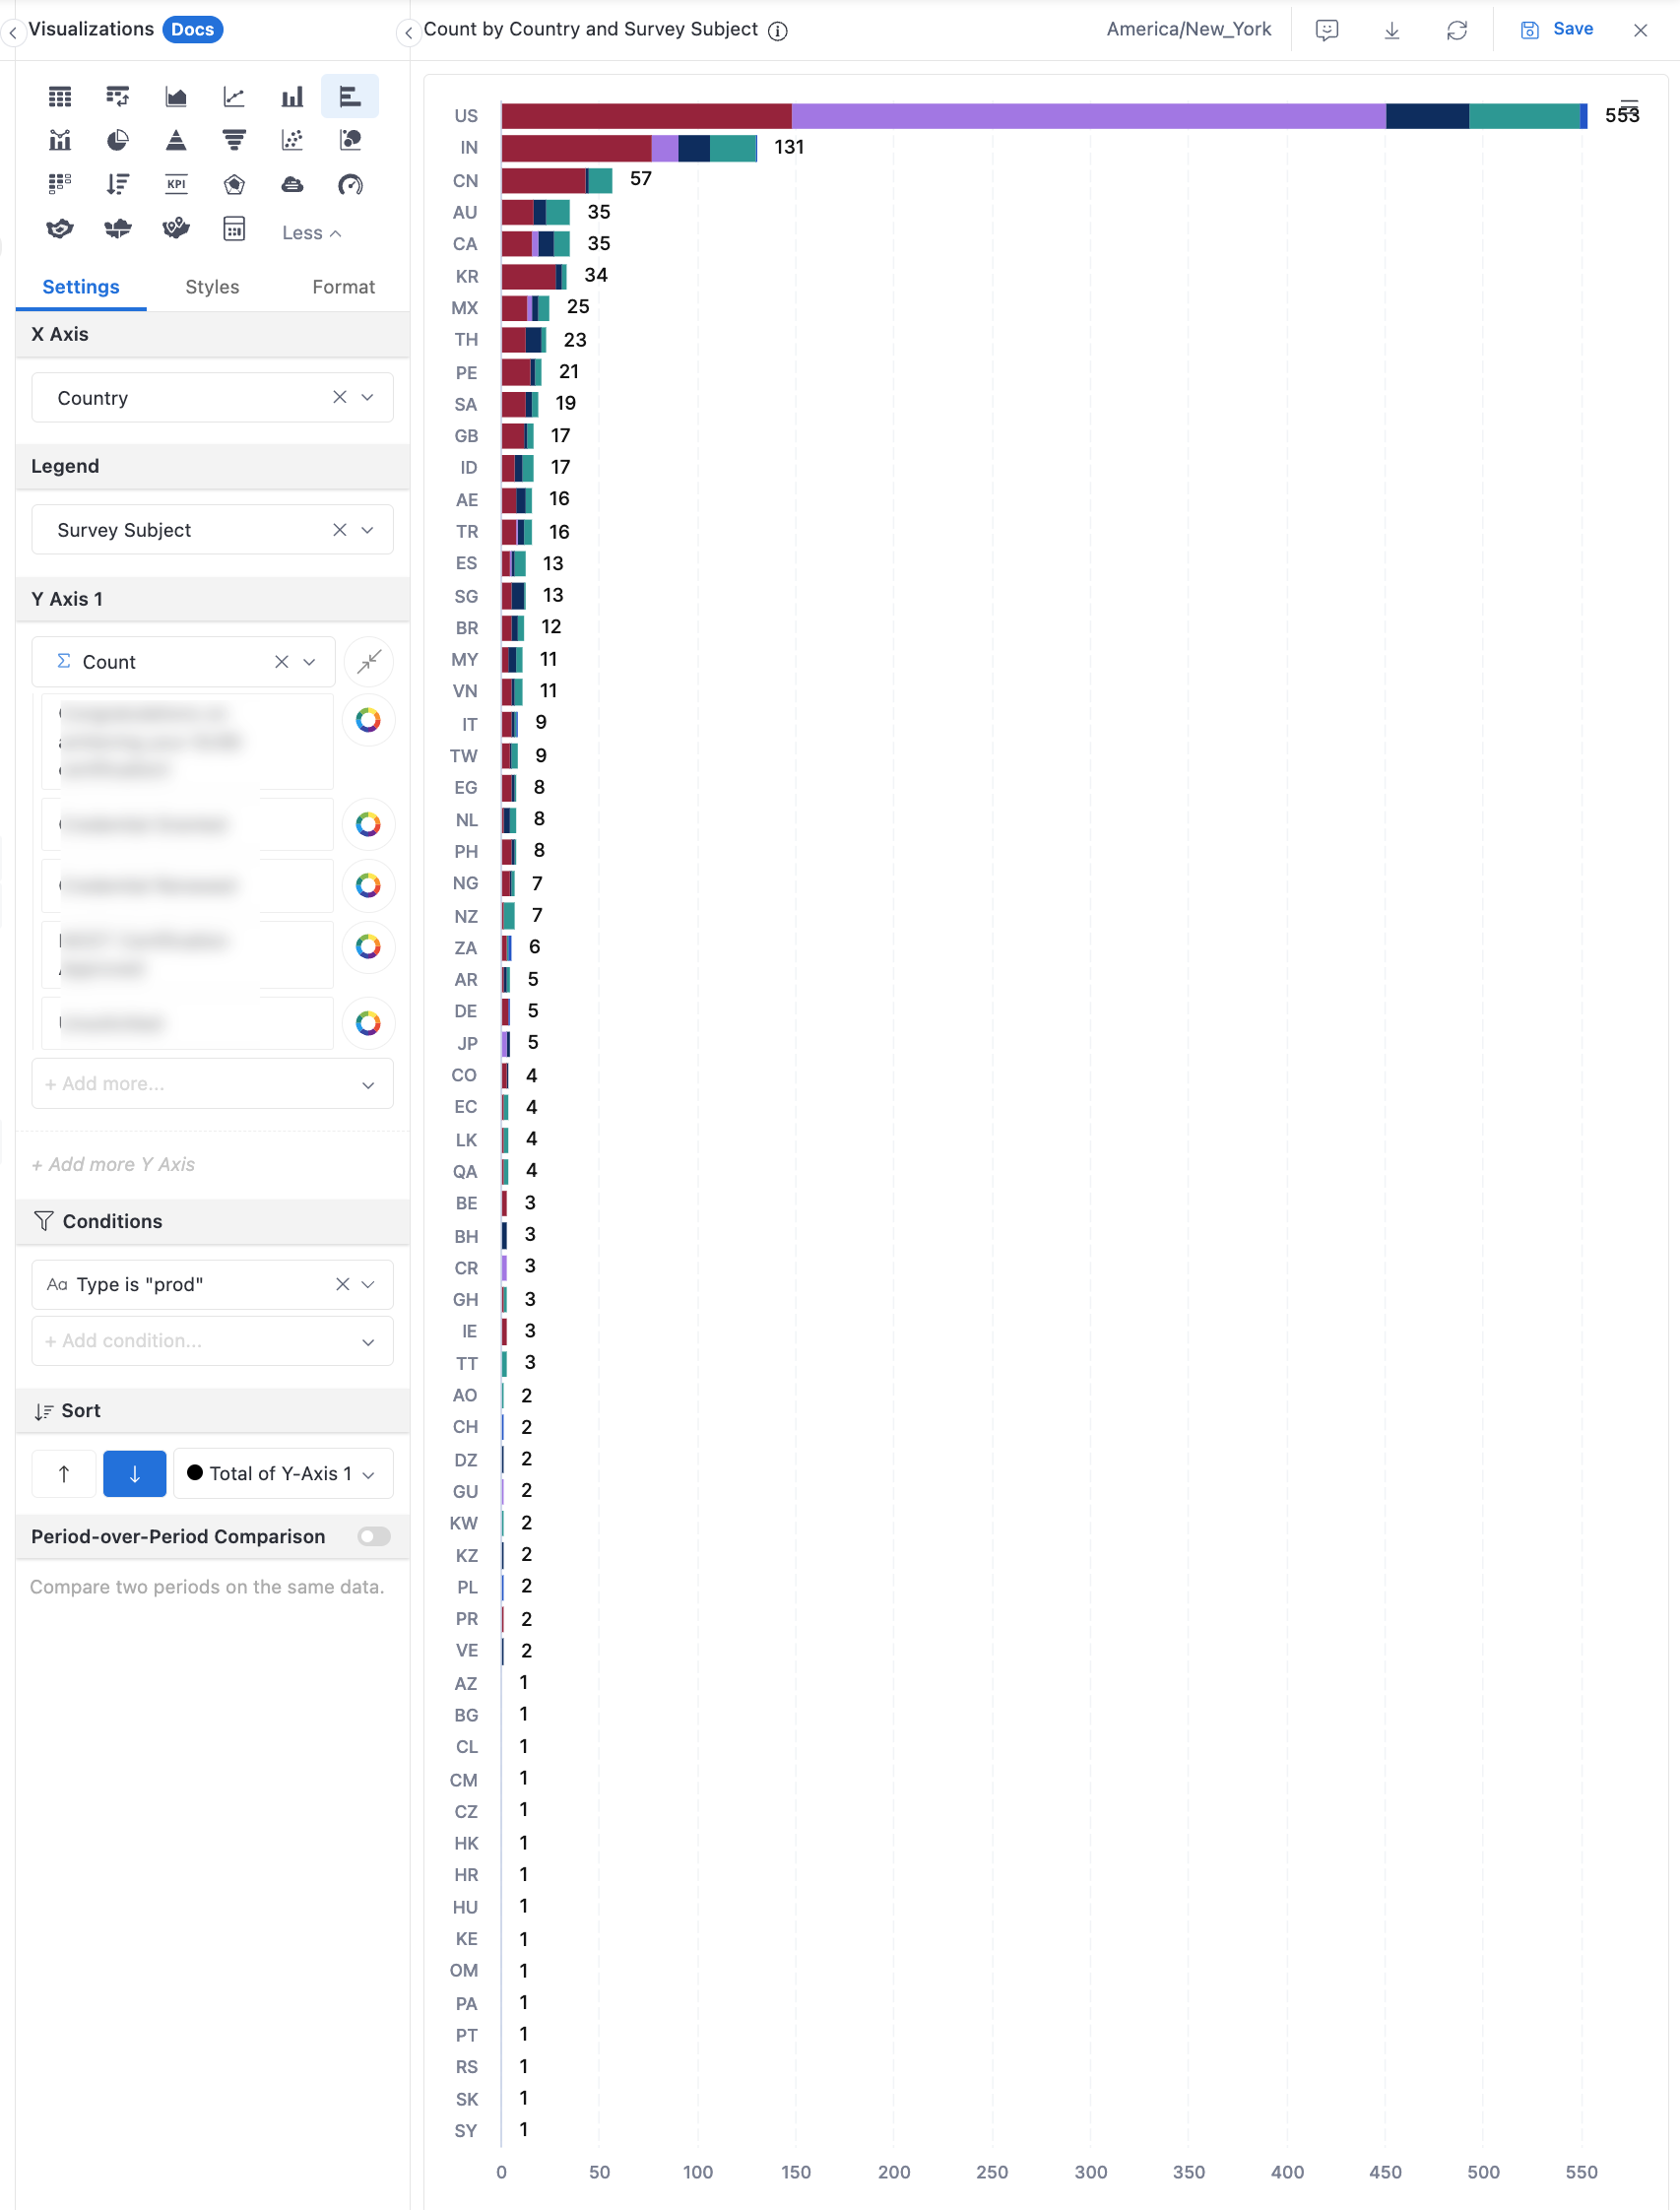
Here’s an example. where I’d like to show the 10x countries, or have the countries w/ <5 total show up as “other”…
Hi @Matt_Stone
Question 1
For this Top 10 x request, I think you could leverage our TopN Filtering. More details could be found in the below community comment from my colleague.
Question 2
Noted on the request, Matt. This would be greatly beneficial for users to control the data and presentation of their chart.
I will add this to backlog for future consideration. ![]()
1 Like