I have a line chart which looks at quantity over time.
I’m trying to add a static line on a specific date to indicate when an event took place - I’ve tried to do this by adding the date into a business calculation but it’s not working. How would I get this to work?
1 Like
Hi Cherice,
Welcome to the Community ![]()
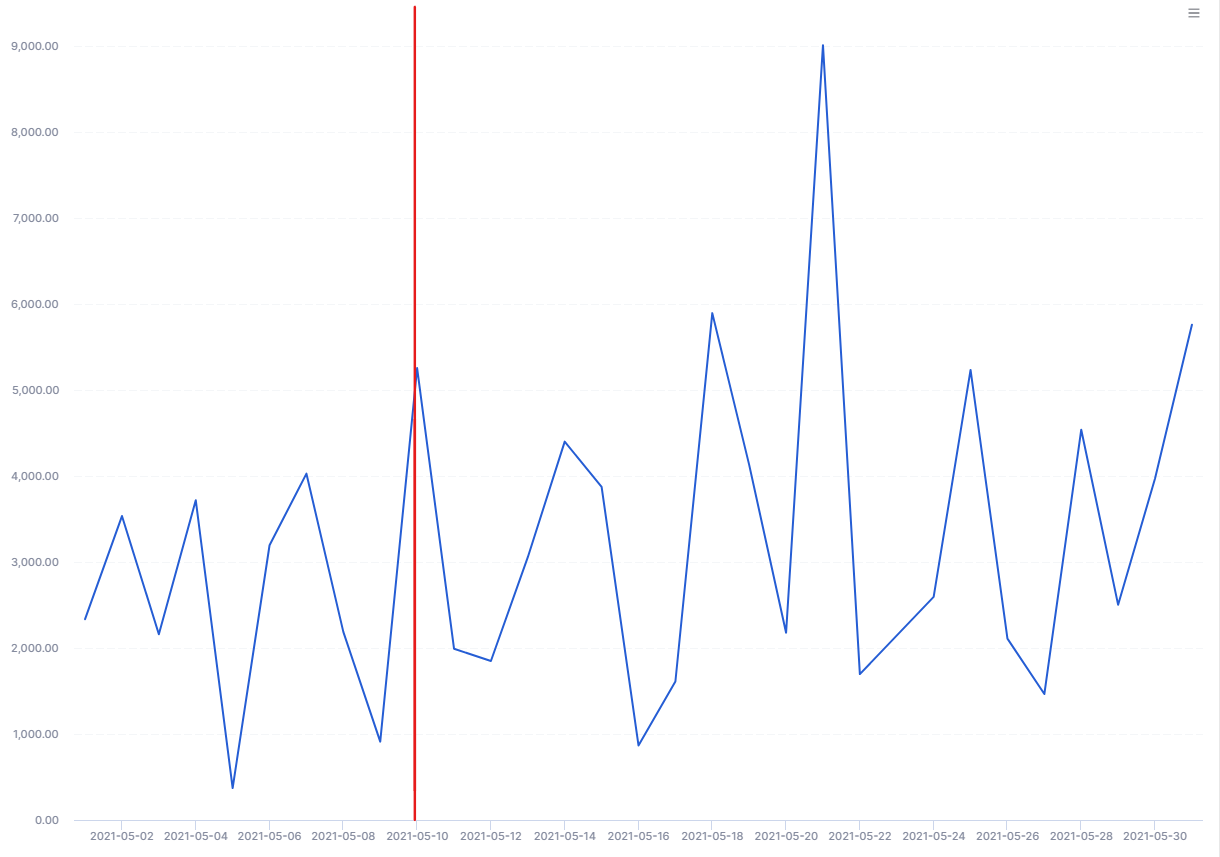
Just to clarify, are you attempting to add a vertical static line on a particular date on the x-axis, similar to what’s shown in the image?
Hi Thinh, thanks for the welcome! Yep, that’s exactly what I’m looking for ![]()