# Timeshift dates to compare events or campaigns
**URL:** https://community.holistics.io/t/timeshift-dates-to-compare-events-or-campaigns/2423
**Category:** Ask the Community
**Created:** [March 27, 2025, 3:56pm UTC](https://community.holistics.io/t/timeshift-dates-to-compare-events-or-campaigns/2423 "2025-03-27T15:56:45Z")
**Posts on this page:** 2
**Page:** 1
### Author:  [@stonematt](https://community.holistics.io/u/stonematt)
#### Post date: [March 27, 2025, 3:56pm UTC](https://community.holistics.io/t/timeshift-dates-to-compare-events-or-campaigns/2423/1 "2025-03-27T15:56:45Z")
we run a couple events per year, each lasting about 2 weeks. I’m trying to compare the event’s volume over time. The first visualization works.
I create an ‘completed\_event\_day’ dataset dimension, so I can count volume on day 1, 2, 3, etc for each event like this:
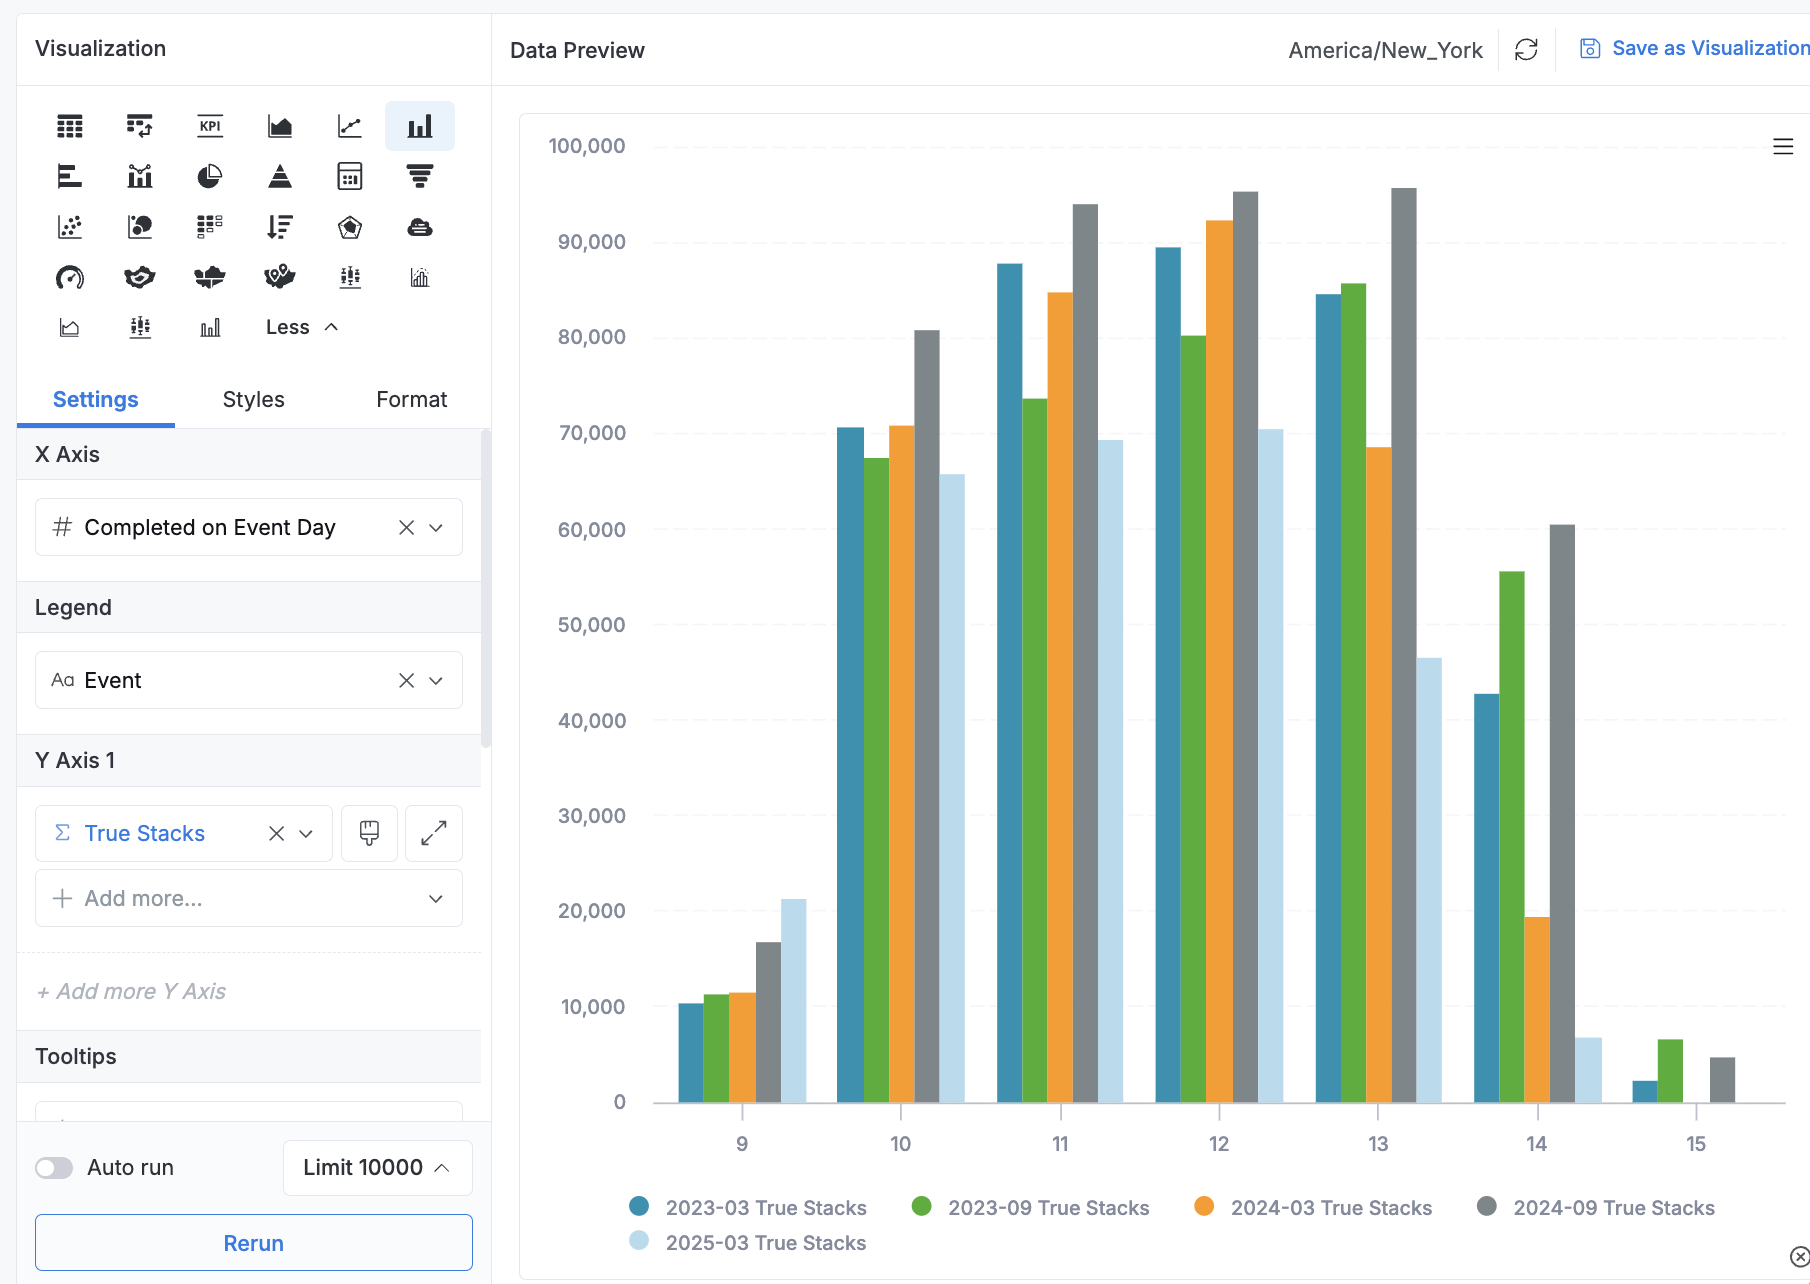
### dimension completed\_event\_day:
```aml
dimension completed_event_day {
model: stack_assignment_timing
label: 'Completed on Event Day'
type: 'number'
definition: @aql date_diff('day', events.event_begins, stack_assignment_timing.completed);;
}
```
### metric percent\_completed
```aml
metric percent_completed {
label: "Percent Completed"
type: "number"
hidden: false
description: ""
definition: @aql ((stack_assignment_timing.t_stacks * 1.0 )/ (stack_assignment_timing.t_stacks | of_all())) ;;
format: "#,###0.00%"
```
## Desire
Create a running total and running percent by completed\_event\_day. I tried the obvious approach, but it seems like running\_total needs a date dimension as it’s running dimension
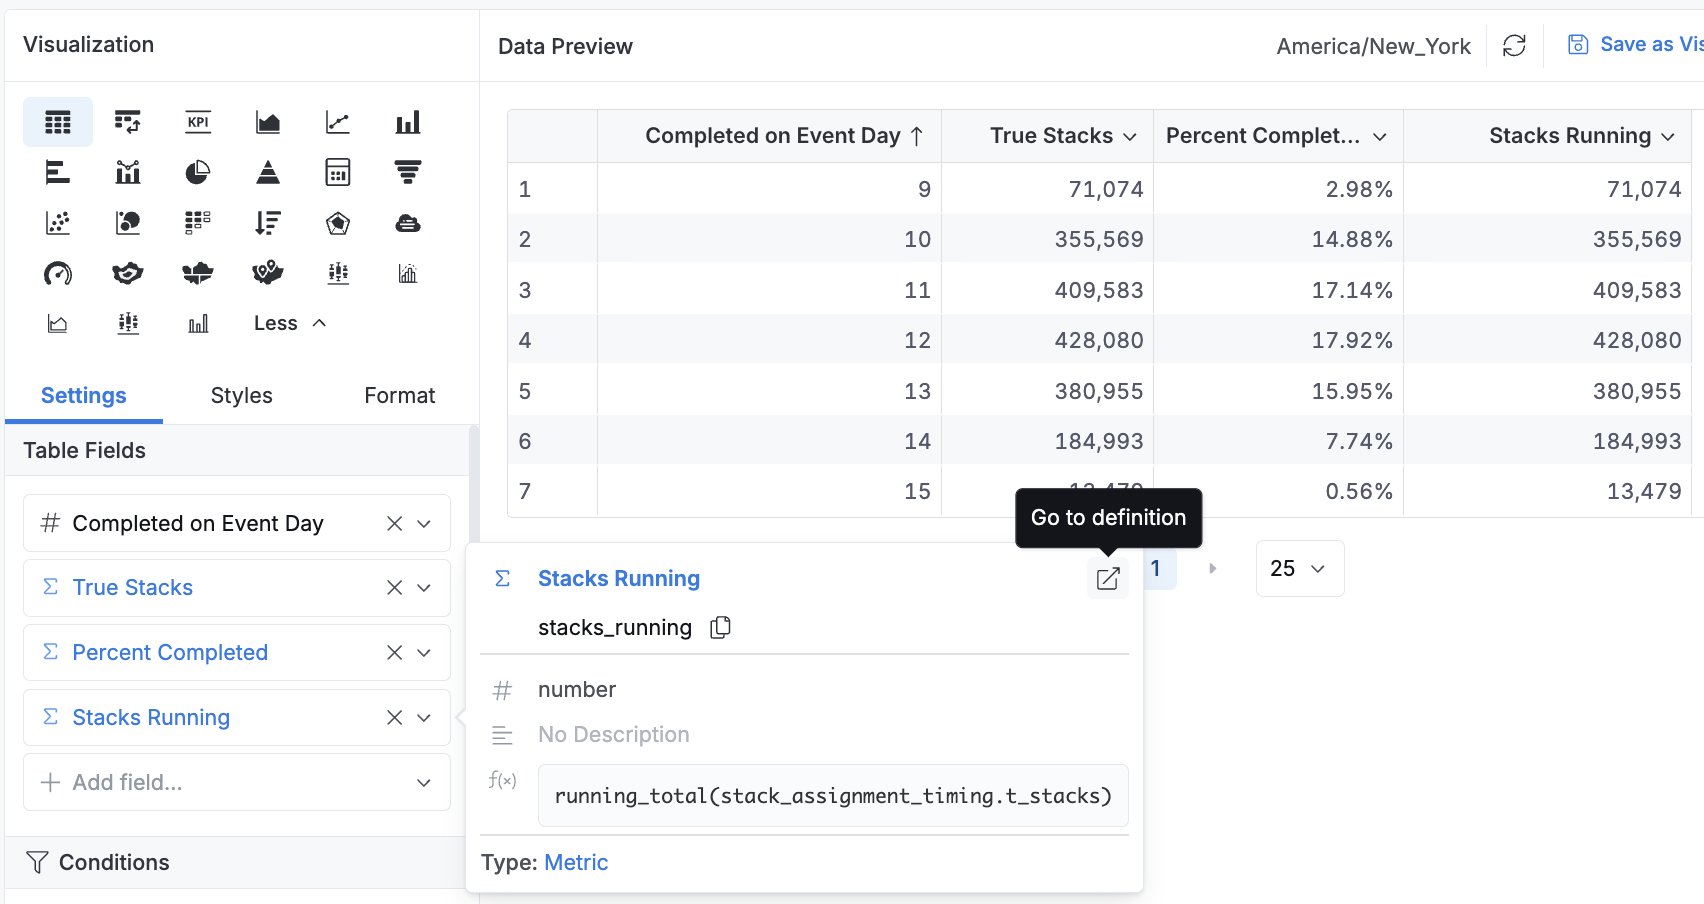
I also tried `running_total(stack_assignment_timing.t_stacks, stack_assignment_timing.completed)` b/c completed it the datetime dimension on the table. I got the saem results in this visualization. Running total isn’t summing over the cmpleted\_event\_day
Advice?
---
### Author:  [@tan](https://community.holistics.io/u/tan)
#### Post date: [March 28, 2025, 3:38am UTC](https://community.holistics.io/t/timeshift-dates-to-compare-events-or-campaigns/2423/2 "2025-03-28T03:38:32Z")
Hi @stonematt,
Yes, by default `running_total` run over all date dimensions in the explore. To make in run along another type of dimension, you must add that dimension to the params. In your case, it would be something like:
```auto
running_total(stack_assignment_timing.t_stacks, stack_assignment_timing.completed_event_day)
```