While 2021 is running to an end, Holistics is all about…Running Total!
Running Total is a very common calculation method that shows how a metric changes over time e.g. how the number of goods sold accumulates over months.
Previously, you could create Running Totals using our Transform Model (guide), though that requires some SQL knowledge. Now, with just a few clicks, you can immediately create a Running Total in visualization settings. Kabam!
In this version, we support 4 types of Running Total: Sum, Average, Min, and Max.
Yeah, ideally I’d like the ability to do a running total of count distinct.
I have unique quote IDs line-by-line for our service - I can count those to get our total number of quotes over a time period - I’d like to be able to use that count as a running total too.
Ah, I see, thanks for sharing. I’ve noted your request down for my team to discuss and consider supporting it in the future.
Also, I created a separate thread for this specific request in case others want to share their use cases too. Please help me upvote it@Rob_B to help our team prioritize our backlog better
it would be great for running total to return values even if there’s no entry in a given period. To illustrate imagine a customer who purchases a product in the last month of every quarter. The running sum of revenue for the company would be increasing every quarter if you look at the data by quarter. However if you change the view to look at running sum of revenue per month there will be nothing for the first two months of every quarter. I would prefer if the first two months showed the same value as the last month of the previous quarter, rather than showing nothing.
Is there a reason to only compute running totals on date dimensions ? I have some usecases where it would be useful to calculate running totals on any numeric value.
For example, I would like to visualise the distribution of my users by quantity of documents produced each year. I would like to calculate the running sum of users by quantity of documents produced in order to visualize where are my top and bottom 10% users.
Totally agree with you that we should be showing the current running sum for the first two months.
The reason Holistics is not showing the number is it’s treating the first two months as having NULL data instead of 0, so the calculation will skip those months and jump straight to the final month of the quarter. That means the key issue is related to how NULL is handled (and converted) in Holistics. We’ve had a plan to work on this project very soon. Will let you know when there are any new updates!
Ah, the current running total is still in its early days, and we are collecting more feedback and ideas to improve it i.e. adding new ways to calculate it.
I still have some trouble visualizing your use case. Could you help share a demo piece of data and how you’d like to visualize it?
We did the analysis below that can be used as an example :
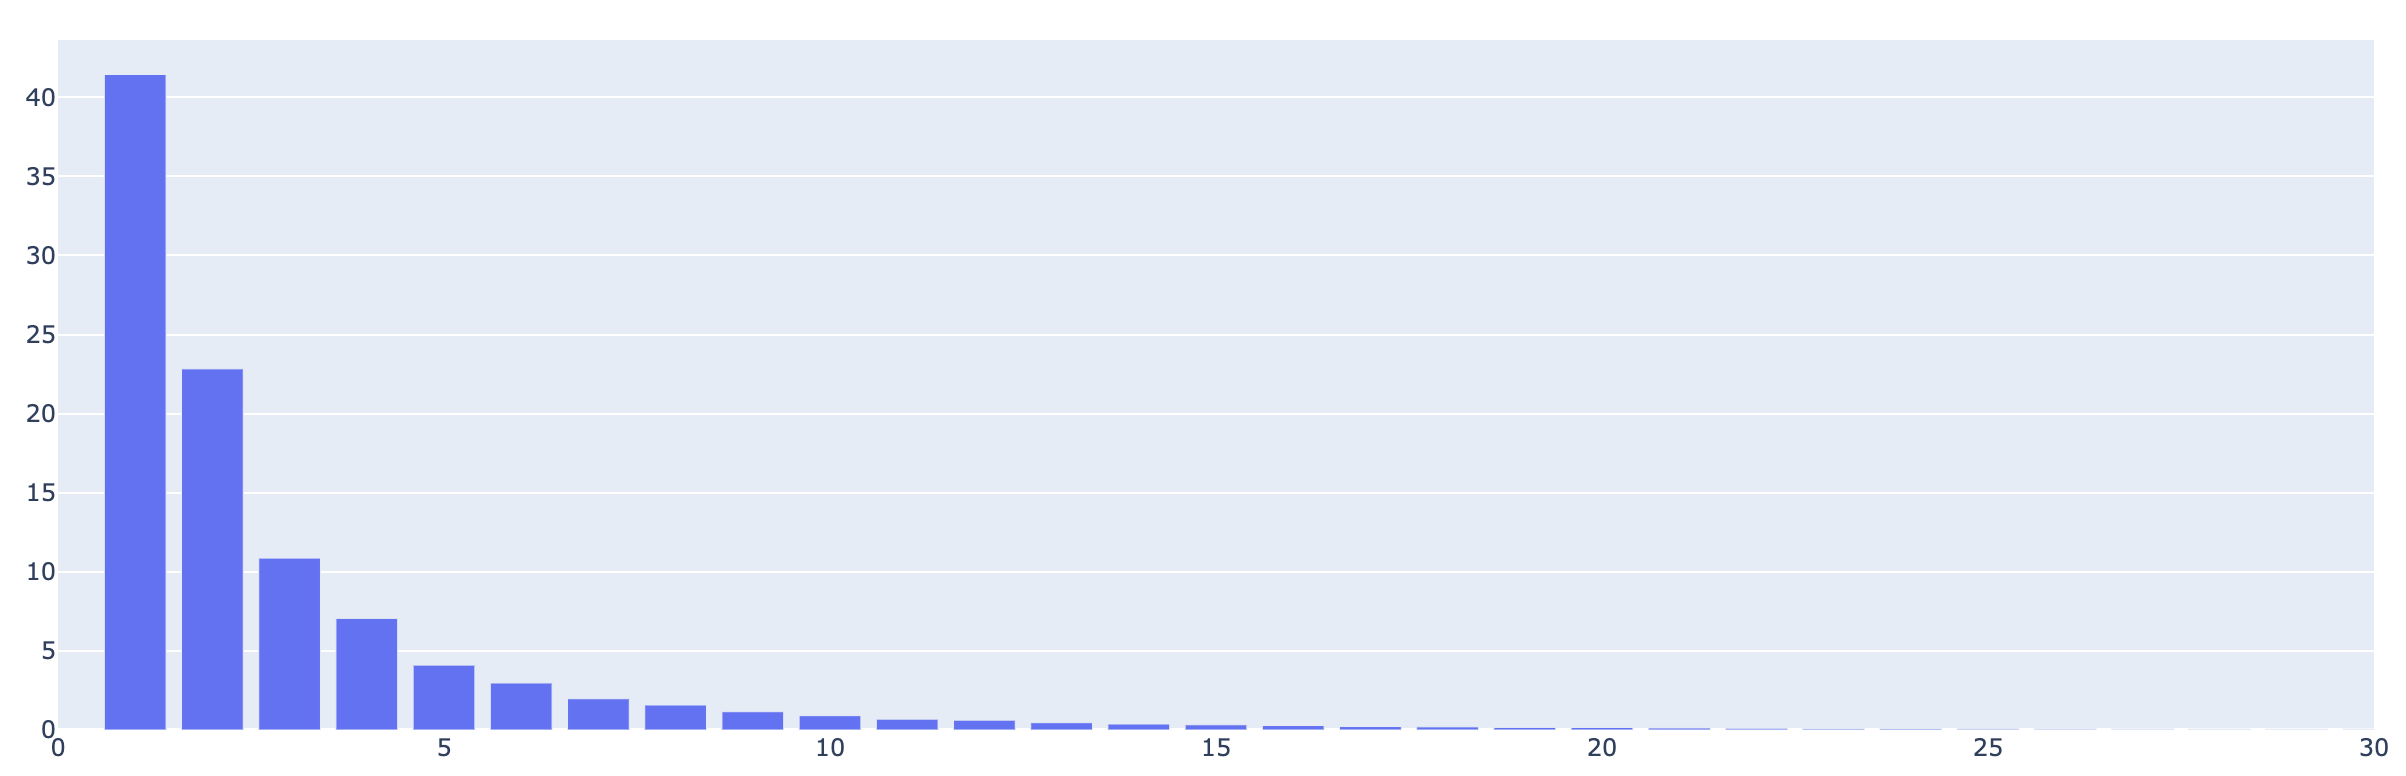
We manipulate a database of customer orders composed of one or more lines of orders and wanted to know how many lines were created for each order. So we made the following chart :
It says that 40% or orders have 1 single line, 22% have 2 lines, …
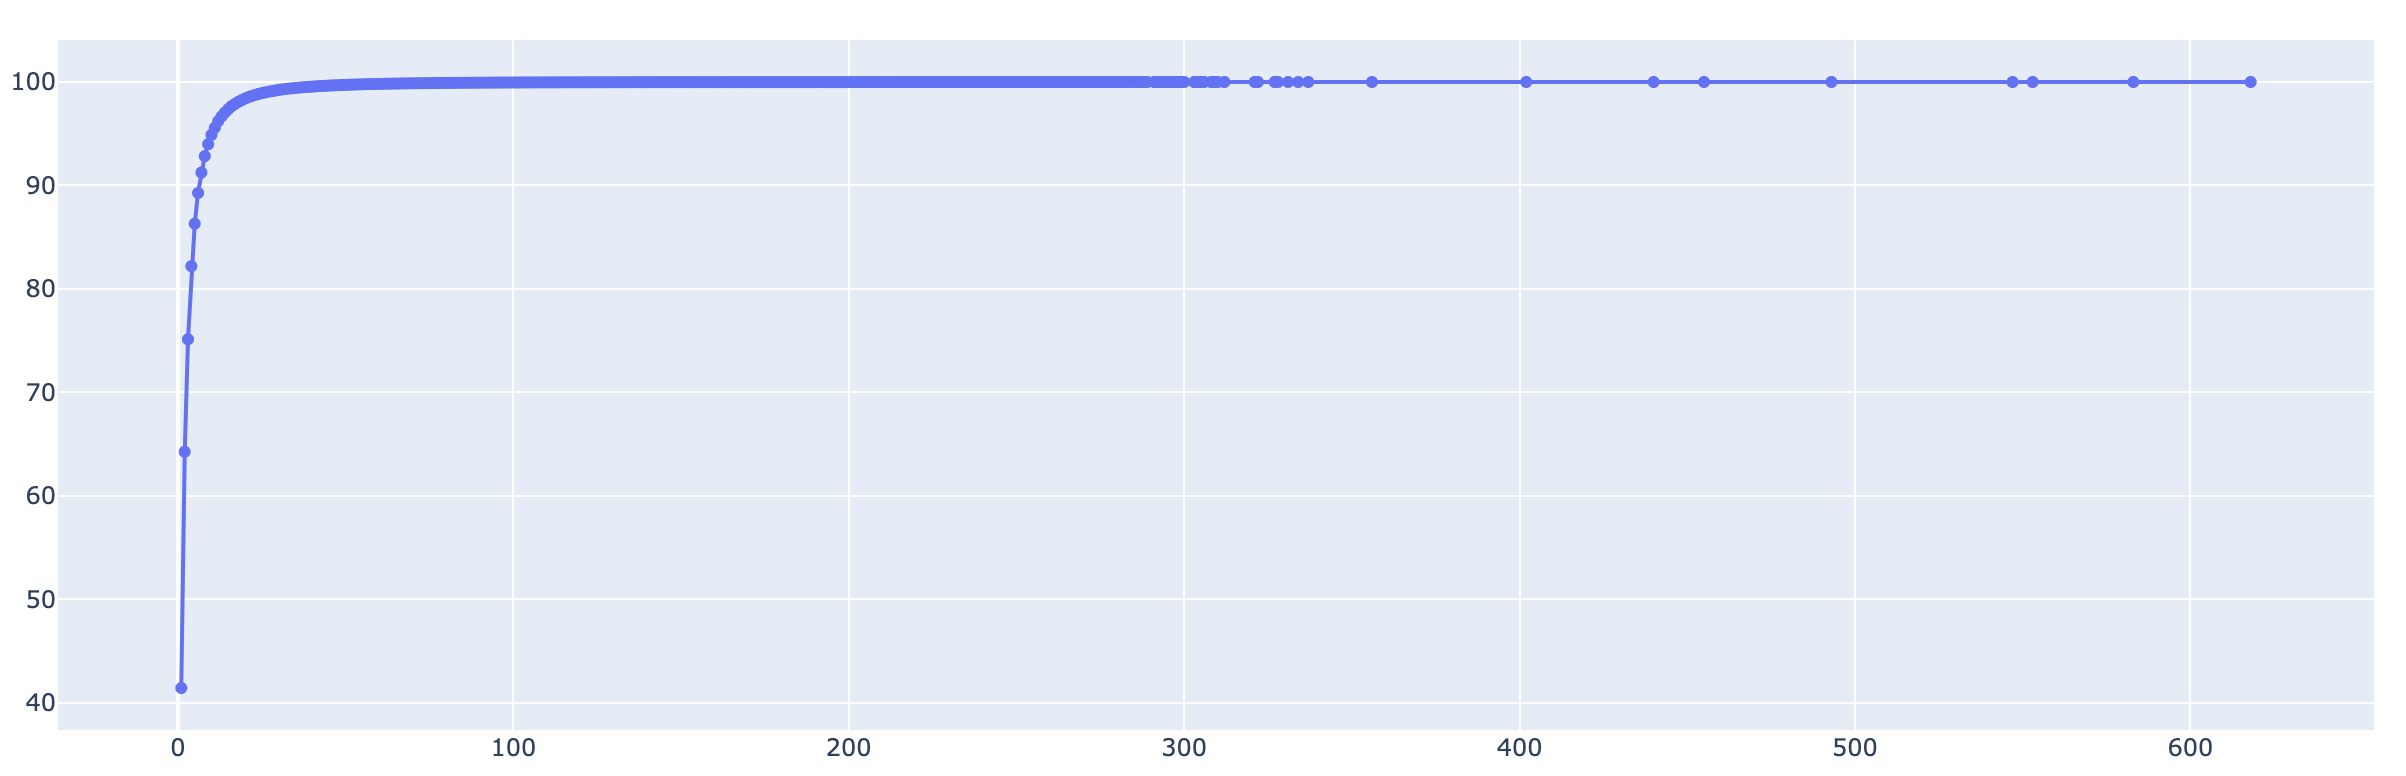
Then, we wanted to know, if we had to limit the number of lines possible for each order, what would be an acceptable value. That’s where the cumulated sum chart is useful :