Hi @Matt_Stone, we do have a repository of custom chart examples here
It’s look like you are asking @anthonytd about the Bubble plot chart here ![]()
Hi @Matt_Stone, we do have a repository of custom chart examples here
It’s look like you are asking @anthonytd about the Bubble plot chart here ![]()
I’ve been taking inspiration from your online GitHub. Thanks for putting that up there. That bubble chart example was promising when I saw the image, but it looks like the wrong definition got checked int.
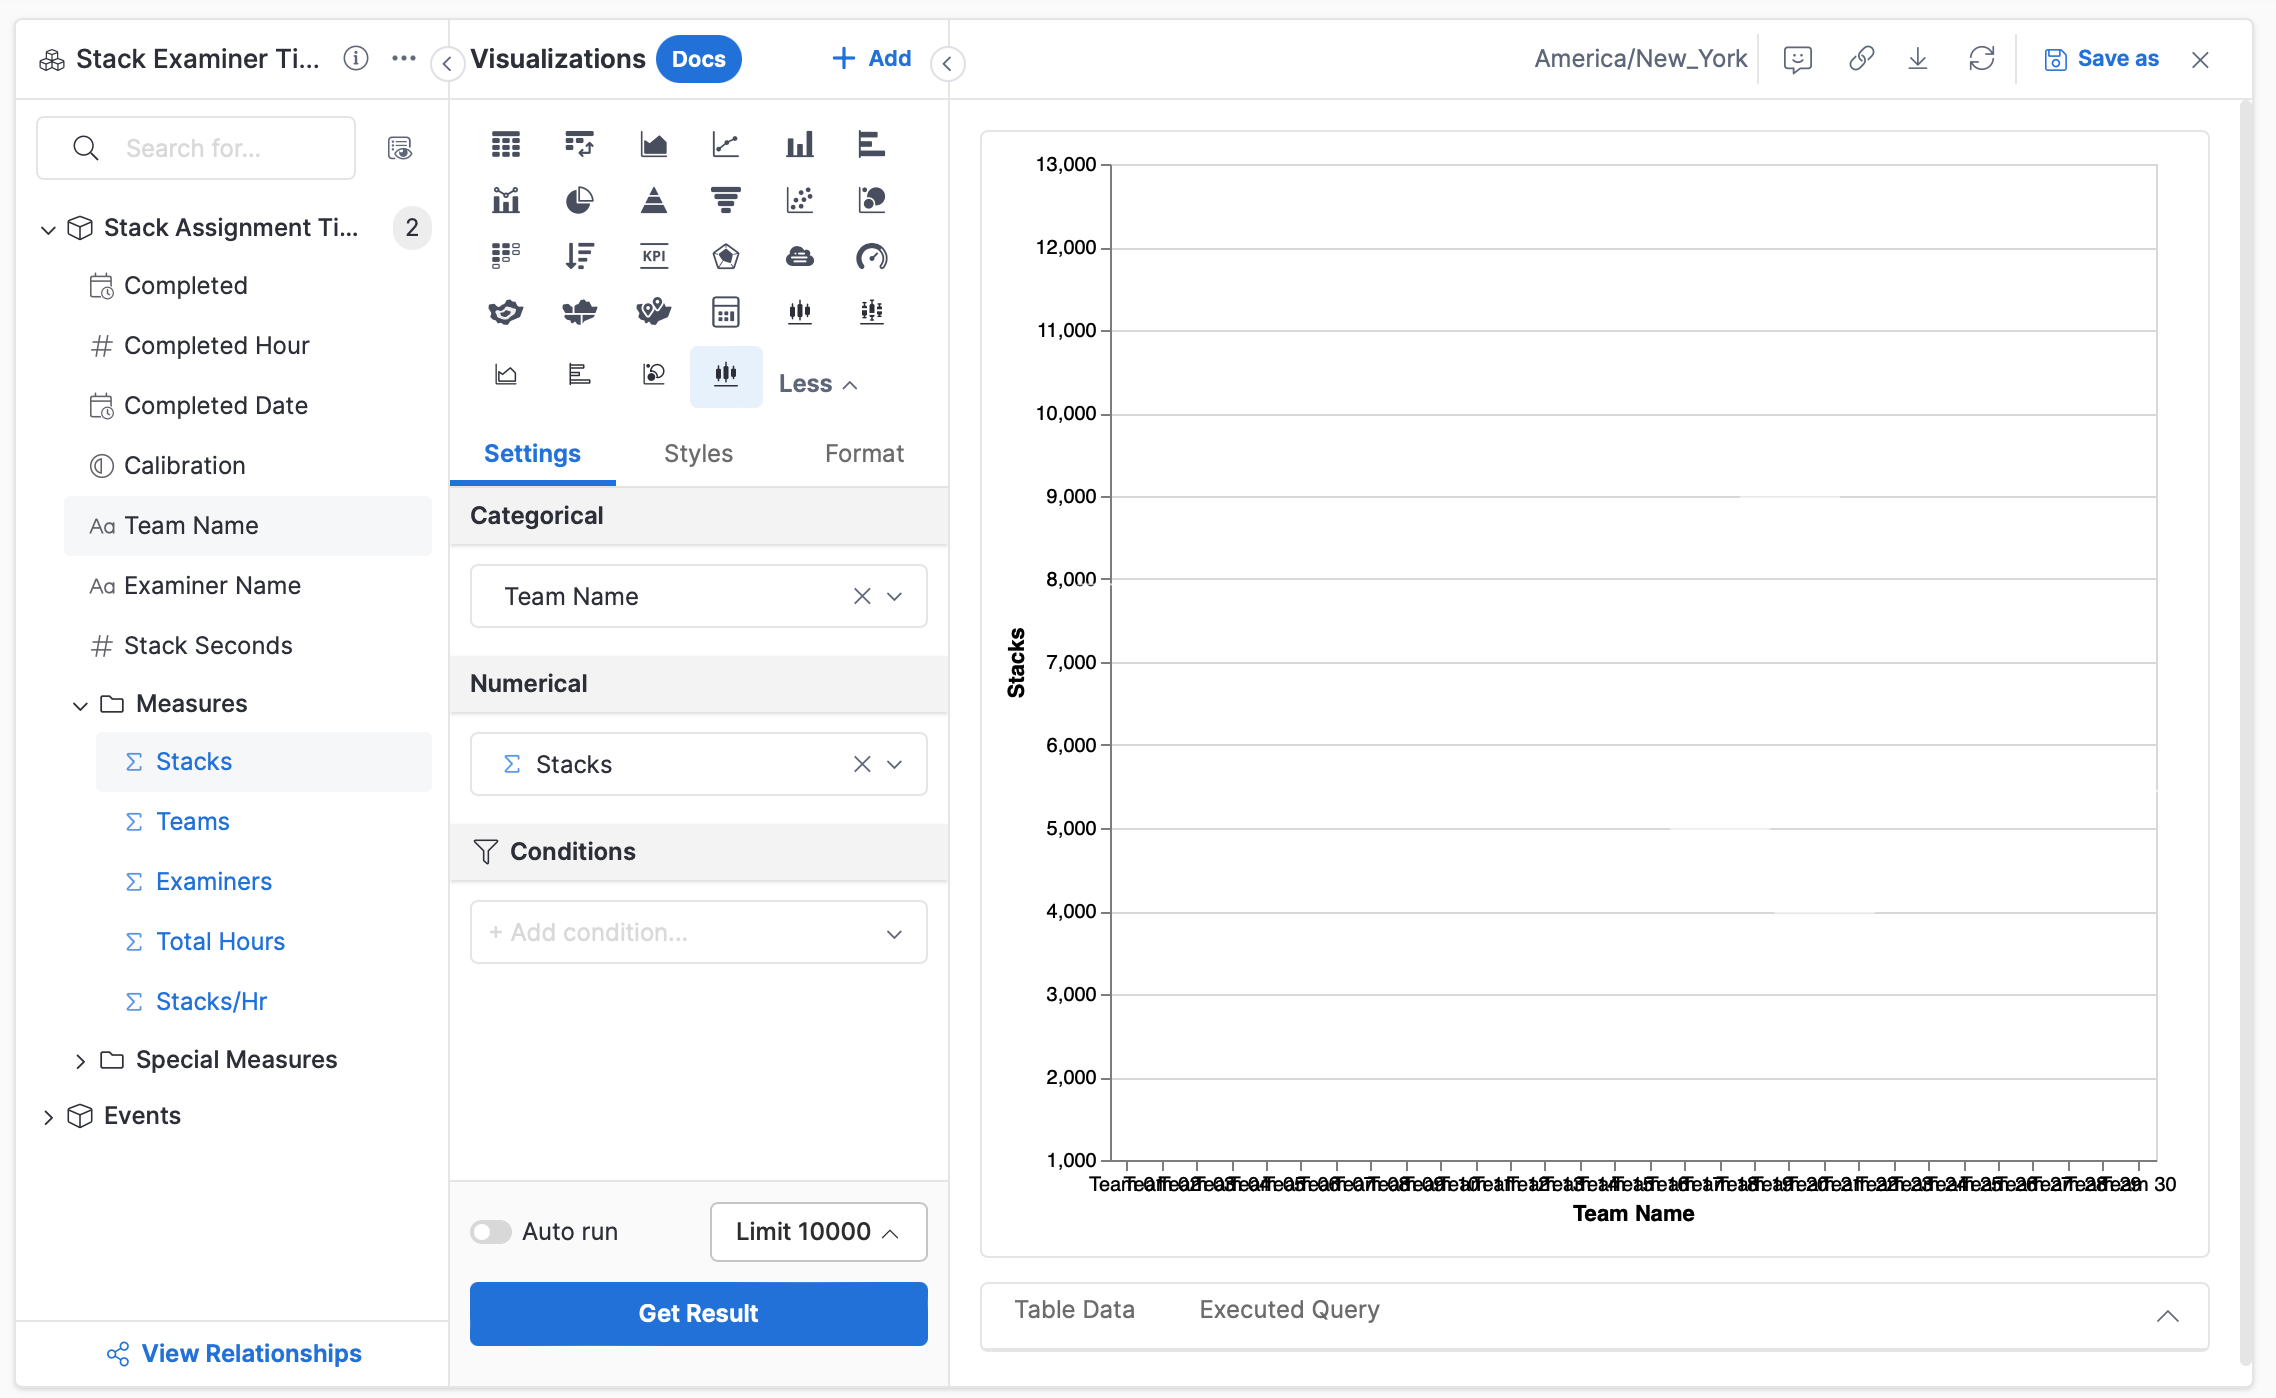
It’s actually an incomplete box plot configuration. Here’s what that definition produces:
That’s why I was trying to track him down.
Hi @Matt_Stone,
Thanks for raising the issue. It seems the mark type was wrong. And we missed the Size dimension for bubble, too.
I just fixed the Bubble Plot template here. It should work now. Please give it another try, and share with us the result ![]()