Hi @shahidt,
Thank you for sharing your use case. You can apply any color palette to a specific chart in Visualization settings (in Block editor)
Expand the field in the Value section, you will see all categories:
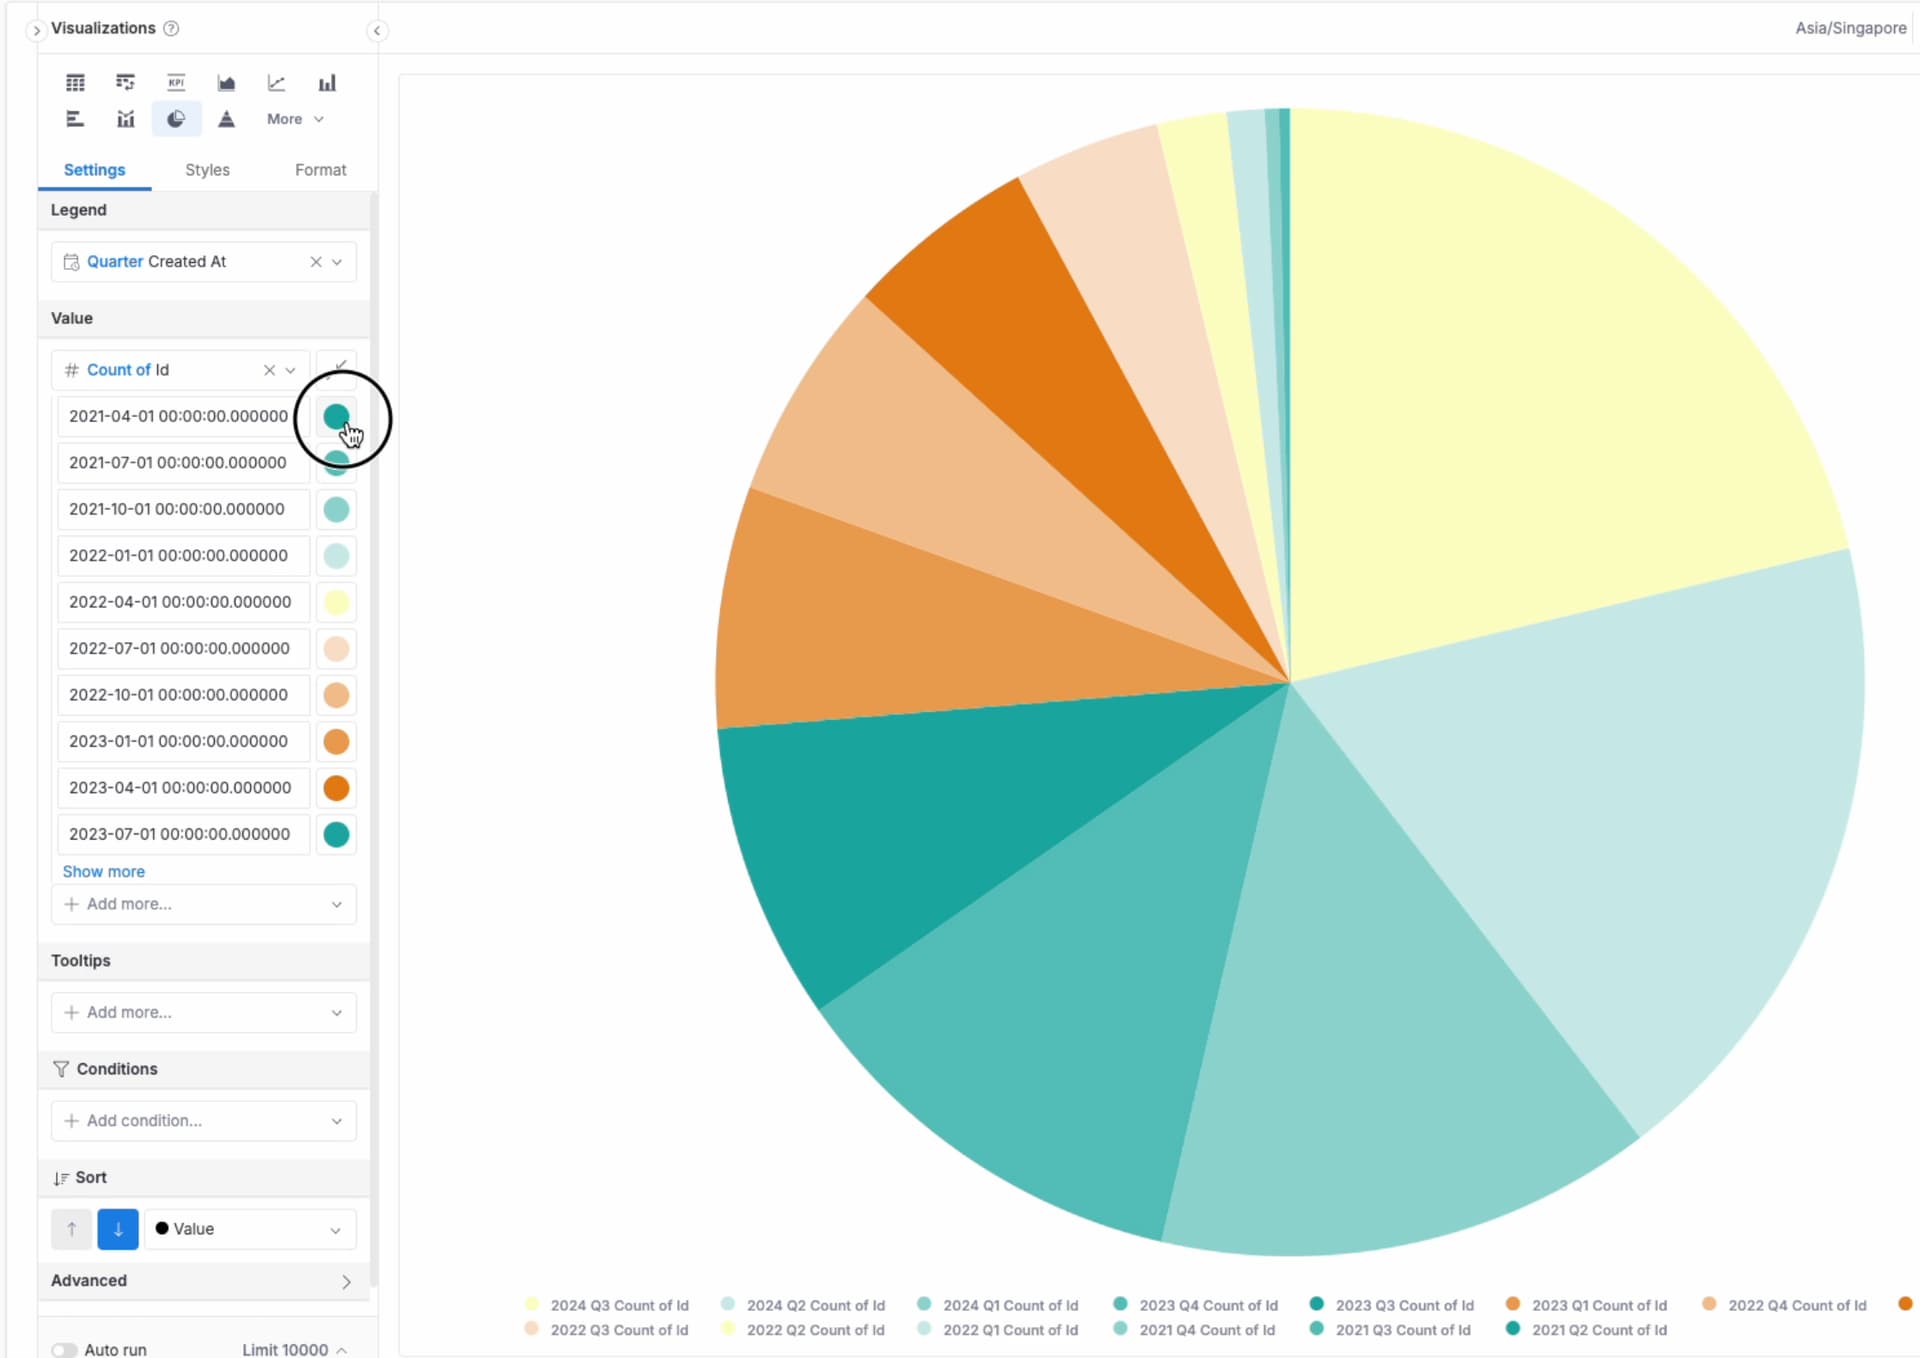
Click on the color on the right of the category name:
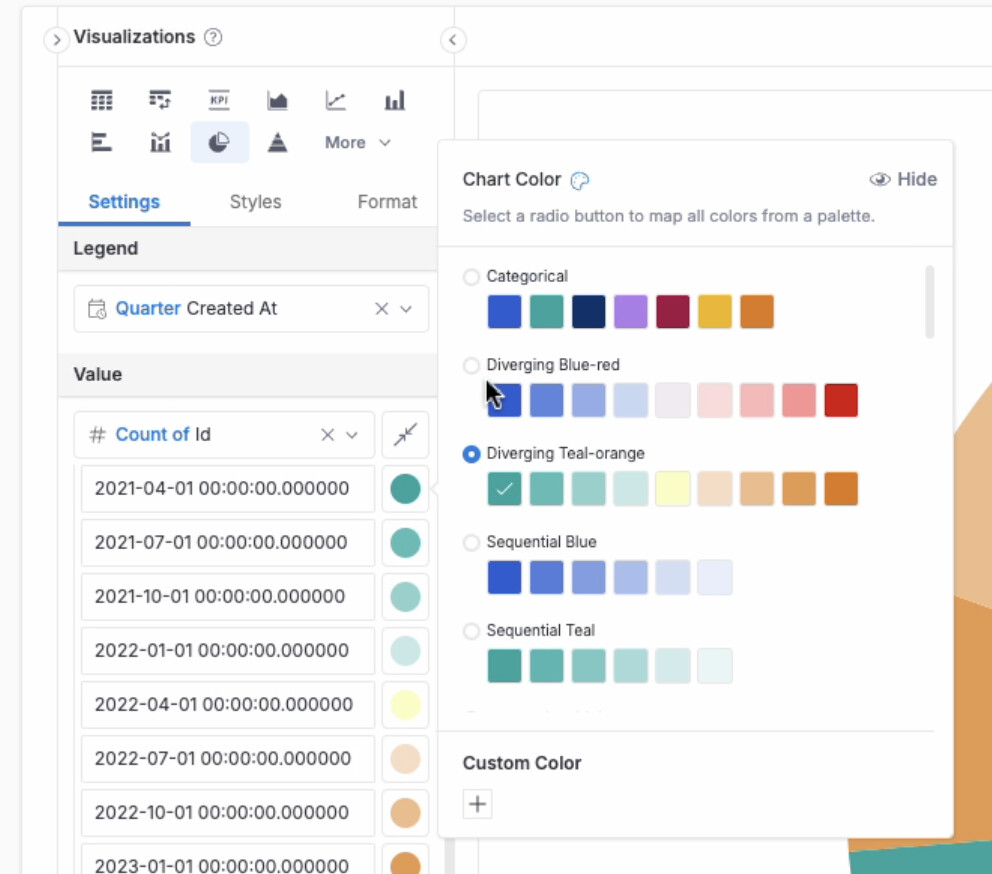
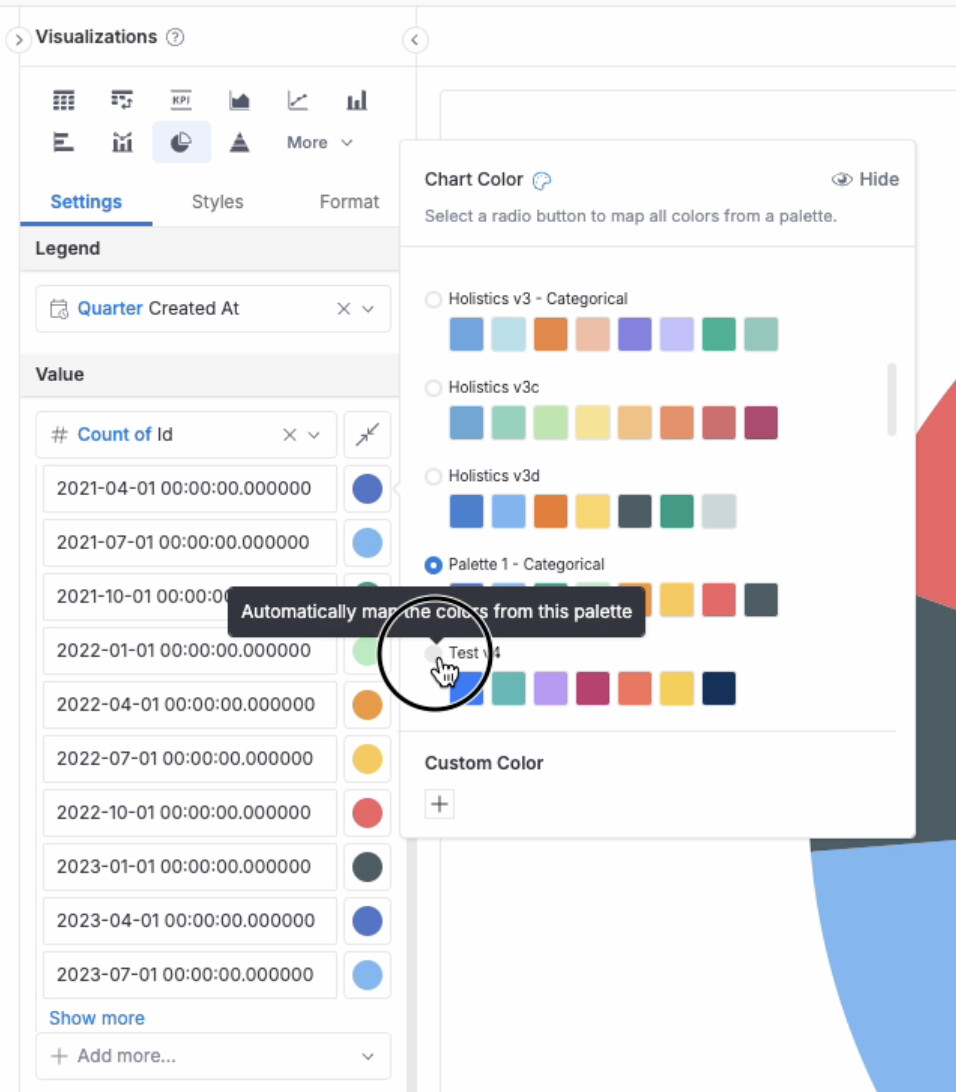
Selecting a color palette (click on the color palette’s label or radio button), the color palette will apply to all values
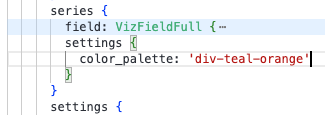
However, our color palette default is created to assign color to categories, not the order of the pie chart. In order to assign the first five colors to the Top 5 categories and the last color to the Other, you have to delete all mapping information in the code:
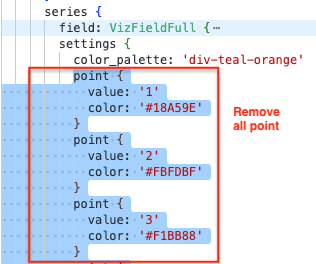
The final code would be:
I hope my reply is helpful to you. Dont hesitate to let me know if you need any further assistance or have any further questions.