Launched: Custom Charts đź“Š

Hey everyone,

We’re thrilled to tell you that we’re working on Custom Charts!

Instead of HighCharts, we will be using Vega-lite (A High-Level Grammar of Interactive Graphics | Vega-Lite) to render the visualizations.

Since this is quite a dramatic move, we’re looking for some beta testers to help us improve this feature.

If you’re interested, please Submit a Support form to request enabling this feature, along with your tenant’s name :raised_hands:t2:.

12 Likes

Kudos to the visualization team, this feature is incredible, I just created a new viz type in less than 30 minutes :love_you_gesture:

image

image

5 Likes

Great stuff @anthonytd !

Any word on when Beta testers might be able to get their hands on it? :slight_smile:

1 Like

+1 on the ETA question. Y’all are teasing us with this :joy:

1 Like

Hey @david-ri , @sm_mk , we’ve enabled it for your tenants and sent you an email with instruction, please help check :wink:

1 Like

Hi @tuan.nguyen , I’m just getting started with trying this out, after being on vacation for a couple of weeks.

Would you be OK with me setting up a thread on this forum to capture thoughts / experience / questions etc?

1 Like

That would be amazing! Please feel free to host any thread!

The custom charts already got me out of a situation when we couldn’t order the layers in an area chart. However, is there a timeline for when these will render on PDF exports?

2 Likes

That’s awesome, @Alex_H :clap:t2:
Can you share some tips on how you managed to order the layers in an area chart with custom charts?

About the PDF exports: Yes, I hear you. And we’re actively working on it, actually. It’s expected to arrive in about 2-3 weeks, along with the official release :muscle:t2:

2 Likes

Brilliant - this is how bottom-up layers were implemented in the custom layer chart.

CustomChart {
  fields {
    field field_1 {
      type: "dimension"
      label: "Horizontal Axis"
    }
    field field_2 {
      type: "dimension"
      label: "Legend"
    }
    field field_3 {
      type: "measure"
      label: "Value"
    }
  }
  options {
    // INSERT OPTION DEFINITION HERE
  }
  // INSERT VEGA-LITE JSON SPECIFICATIONS BELOW
  template: @vgl {
    "$schema": "https://vega.github.io/schema/vega-lite/v5.json",
    "width": 300, "height": 200,
    "data": {"values": @{values}},
    "mark": {"type":"area","opacity":0.6, "stroke":"black","strokeOpacity":{"expr": "0.6"}, "strokeWidth":2},
    "encoding": {
      "x": {
        "timeUnit": "yearmonth", "field":  @{fields.field_1.name},
        "axis": {"formatType": "time", "title":@{fields.field_1.name}}
      },
      "y": {
        "aggregate": "sum", "field":  @{fields.field_3.name},
      },
      "color": {
        "field": @{fields.field_2.name},
        "scale": {"scheme": "category20b"},
        "sort":"ascending",
        "legend":{"orient": "bottom", "formatType":"time",   "columns":12 }
        
      },
      "order": {"field":@{fields.field_2.name}, "sort": "ascending" }
    }
};;
}
2 Likes

Hi @vu.duong,

Is also Histogram possible now?

Hi @Abdel,
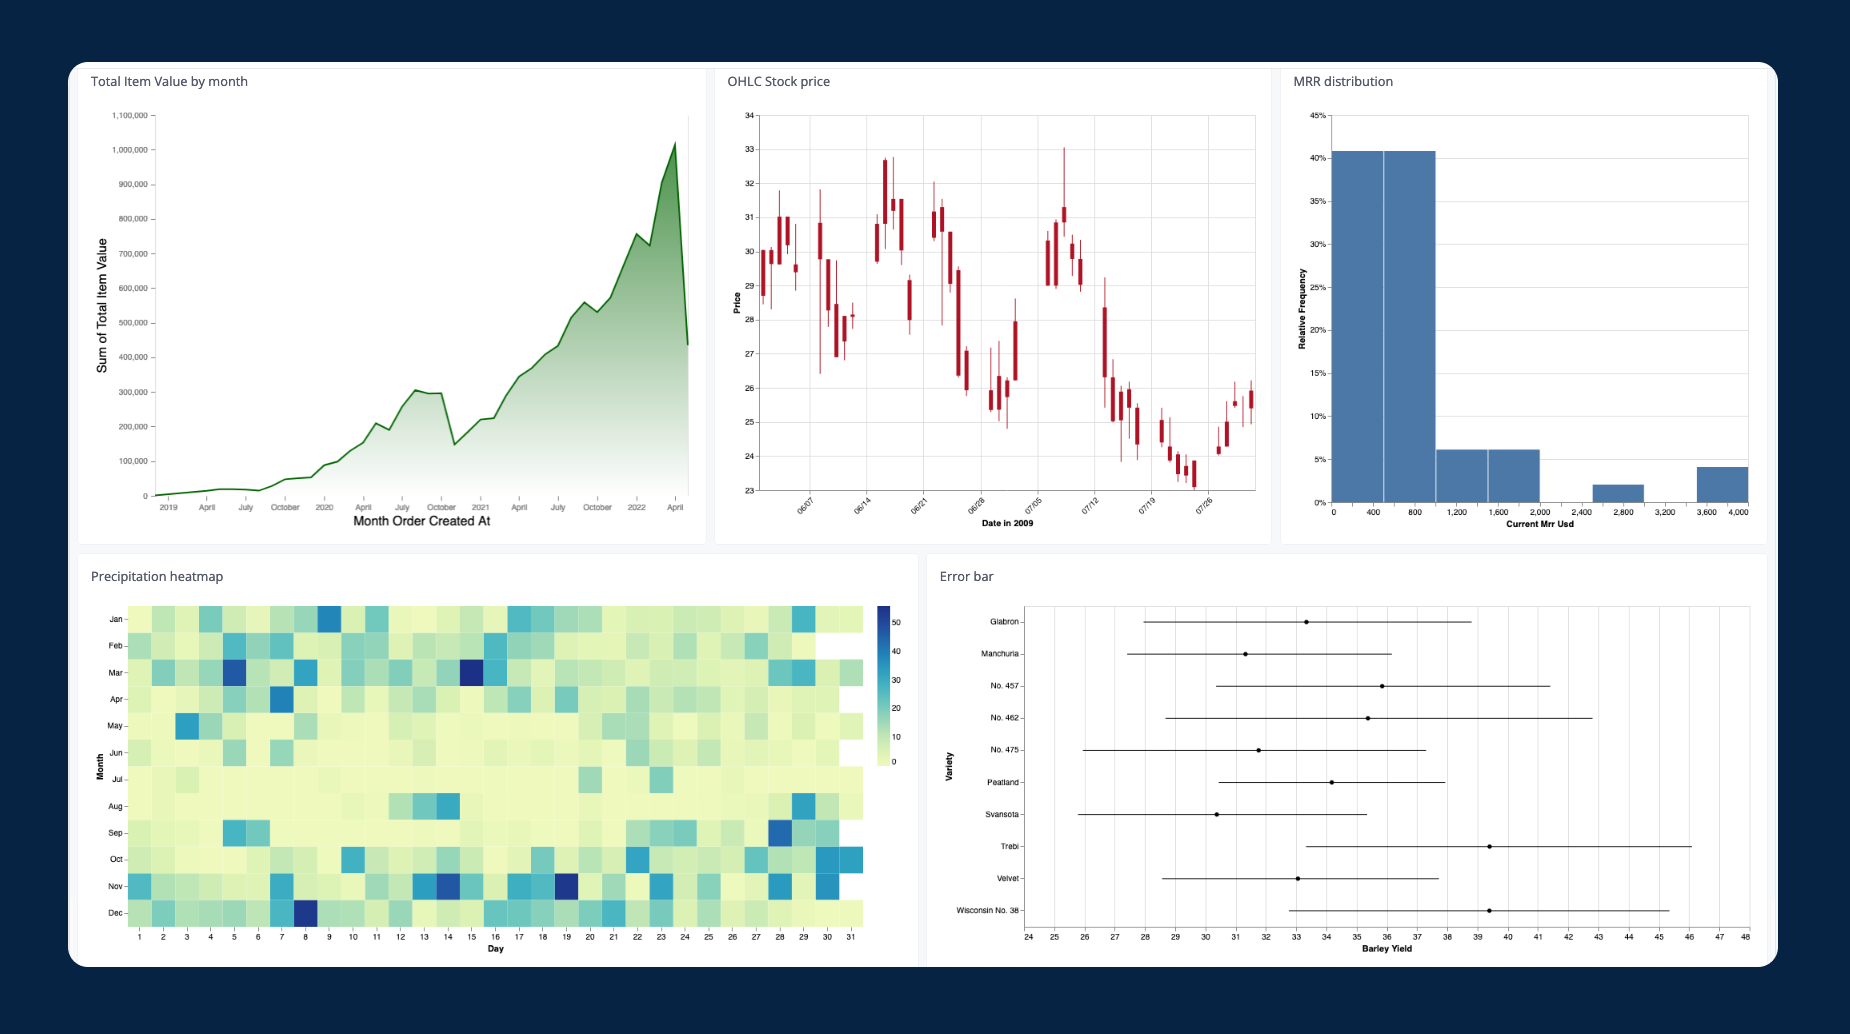
Absolutely, you can now create Histogram using Custom charts! Would you like to try out this feature in its Beta phase?
Also, we are going to release it officially (finally) soon in the next few days, along with several improvements. But you can still request the “early access” to try now :slightly_smiling_face:

Update on this: We’re finishing some interactive capabilities for custom charts, so the official launch might be delay for a couple of weeks. But in the meantime, you can still request to enable the beta for your tenant :muscle:t2:

Hi @vu.duong
Great.
Please add our tenant to beta testing for custom charts. I assume this will not affect any other charts right?

1 Like

Sure thing, @Abdel! Let me add your tenant to the beta testing list really quick. I’ll also send out an email to you on notes & guides for this Beta version.

And yes, all Holistics’ default viz types will remain available, so no effect on your current reports. Cheers! :beers:

Hello @vu.duong, I want to use Custom charts to build Histogram, can you add my team to be able to use this feature?

1 Like

Hi @Quang_Ng, absolutely :+1:t2:
Could you help submit a support ticket for your request, including the name of the tenant(s) you want this feature enabled for?

1 Like

@vu.duong Can you share where I can submit a support ticket? sorry I’m new here

Hello @Quang_Ng !

After logging into Holistics, click on the Help “?” icon at the top-right and you can select “Contact Support” from the drop-down menu.
Capture

1 Like


After a fruitful Beta program, we are glad to announce our Official release of the Custom Charts feature!

During this Beta phase, we’ve released some significant upgrades that make Custom Charts even more robust but also more friendly, which include:

  • :white_check_mark: Holistics’s interactive features (Cross-filter, Date-drill, Drill-through, etc.)
  • :white_check_mark: Export/Schedule & Data Alerts
  • :white_check_mark: Holistics data format
  • :white_check_mark: Several huge UX improvements (Code comments, Chart icons, and many more)

We’ve also gathered many amazing Custom Chart templates, made by both Holistics team and community members, on our Github library.

Check it out at: :books:Holistics’ Custom Chart Library!

Huge thanks to our beta users for your interest and great supports along the way!
For additional information, please refer to our public document: Custom Charts | Holistics Docs.

Cheers! :beers:


Further notes:

  • Custom Charts will be released to all customers in Standard plan and above, following the latest Pricing version (learn more).
    • For (1) customers who are eligible for Custom Charts but cannot find it in-app, or (2) customers in Entry plan & would like to give this feature a spin, please let us know via this form: Holistics Custom Charts Enquiry Form.
  • For beta testers who are in Entry plan, we’d love to offer you a 3-month trial to continue using the feature. Please let us know if you are interested in further trial.
4 Likes

@anthonytd
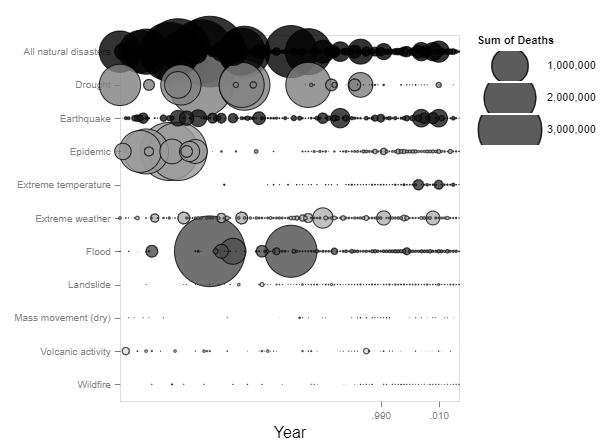
I build added a box plot w/out too much trouble, then tried to replicate your bubble chart by categories. Do you still have this custom chart config sitting around? I tried to configure this one, and couldn’t quite dial it in.

I’m getting this:

with this configuration:

CustomChart {
  fields {
    // x as time (or continuous)
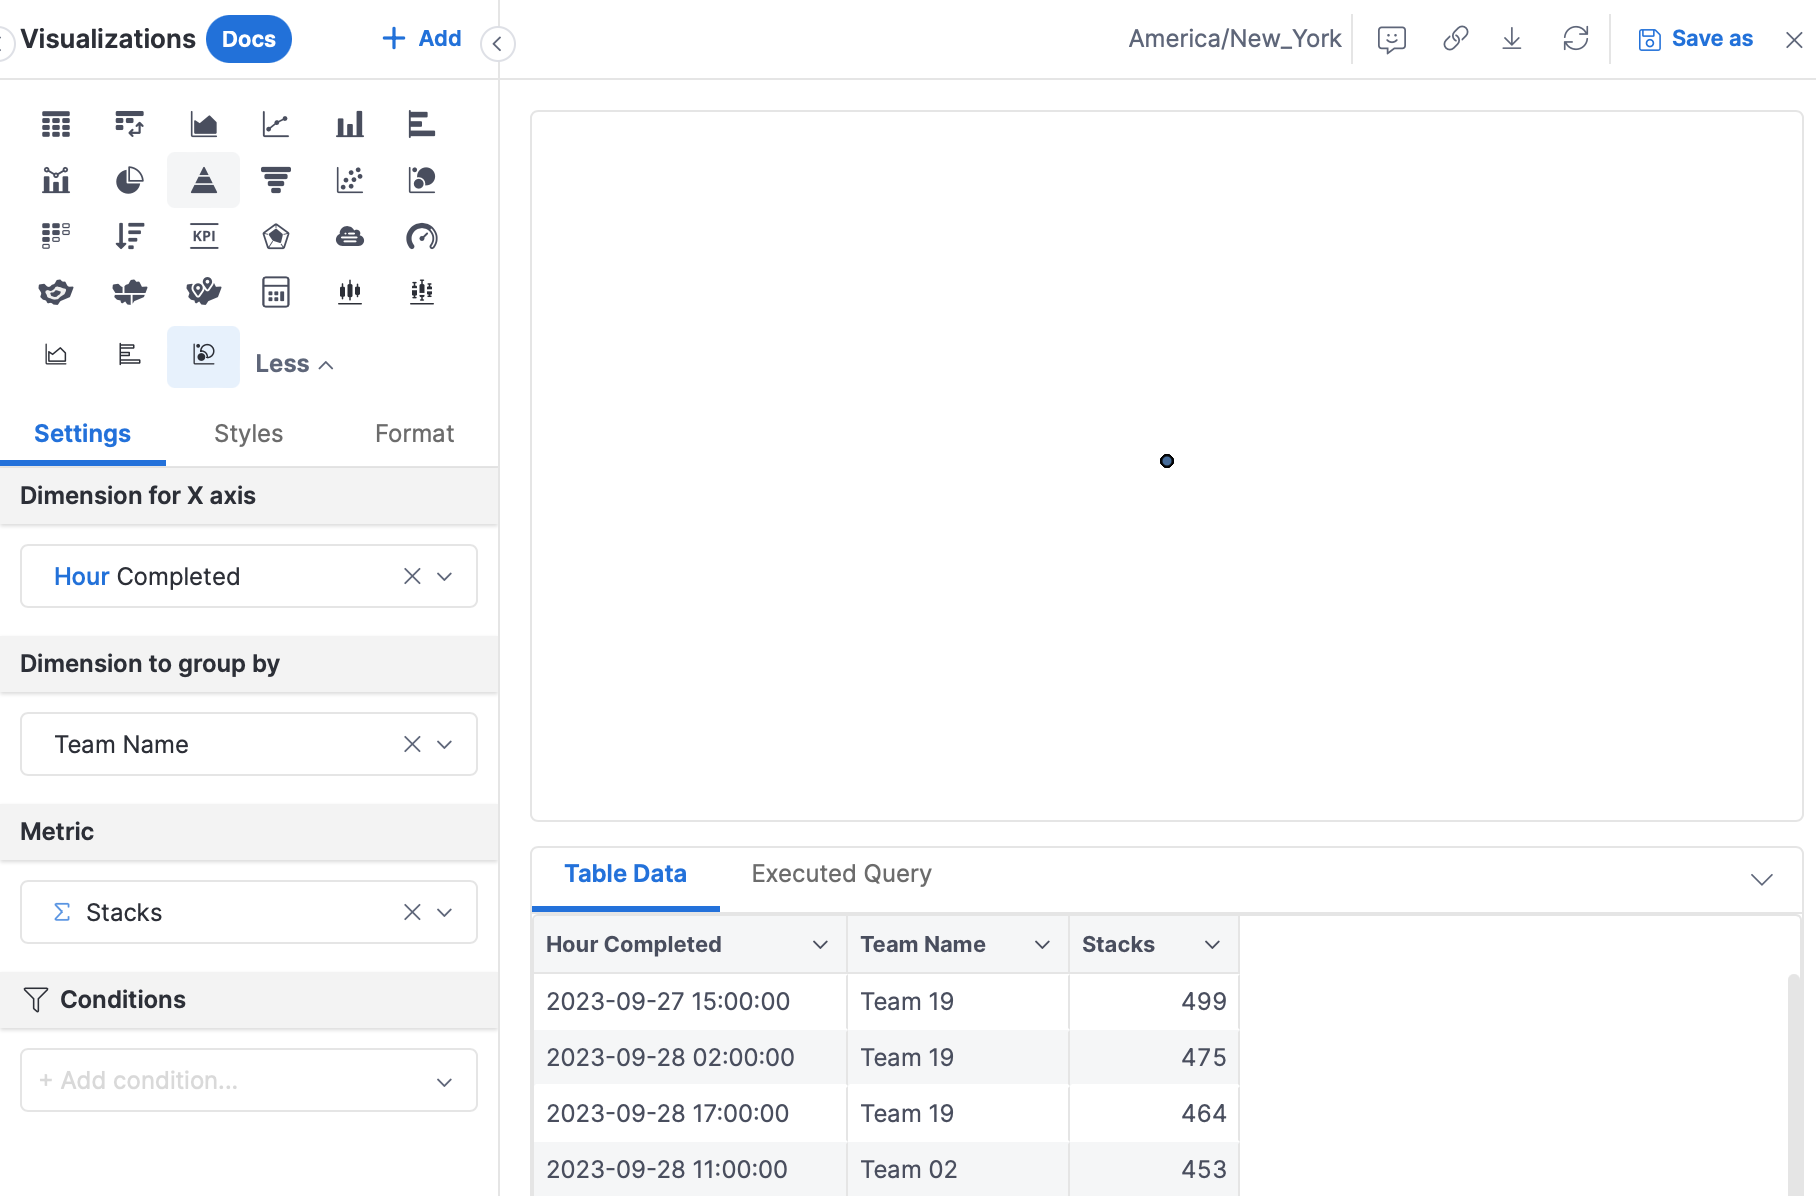
    field x {
      type: "dimension" 
      label: "Dimension for X axis" 
      sort {
        apply_order: 1
        direction: "asc"
      }
      data_type: "date"
    }
    // group (category)
    field group {
      type: "dimension" 
      label: "Dimension to group by"
      sort {
        apply_order: 2
        direction: "asc"
      }
    }
    // measure
    field measure {
      type: "measure" 
      label: "Metric"
    }
  }

  options {
    // more to come when the simple one works
  }
  
  template: @vgl {

    "data": {"values": @{values}},

    "width": 600,
    "height": 400,
    
    "mark": {
      "type": "circle",
      "opacity": 0.8,
      "stroke": "black",
      "strokeWidth": 1
    },

    "encoding": {
      "x": {
        "field": @{fields.x.value},
        "title": @{fields.x.name},
        "type": "temporal",
        "axis": {"grid": false}
      },
      "y": {
        "field": @{fields.group.value},
        "type": "nominal"
      },
      "size": {
        "field": @{fields.measure.value},
        "type": "quantitative",
        "legend": {"clipHeight": 20}
      }
    }
  };;
}

I’m wondering if it has to do with the raw data getting sent to Vega-lite for the datetime dimension like this:

SELECT
  TO_CHAR((CAST ( (DATE_TRUNC ( 'month', (CAST ( "stack_assignment_timing"."completed" AS timestamptz )) AT TIME ZONE 'America/New_York' )) AT TIME ZONE 'America/New_York' AS timestamptz )) AT TIME ZONE 'America/New_York', 'YYYY-MM-DD HH24:MI:SS.US') AS "dm_sat_c_005c5a",
  "stack_assignment_timing"."team_name" AS "sat_tn_8bb5e9",
  COUNT("stack_assignment_timing"."stack_assignment_id") AS "c_sat_s_49aabc"

Any help is appreciated.

.stone